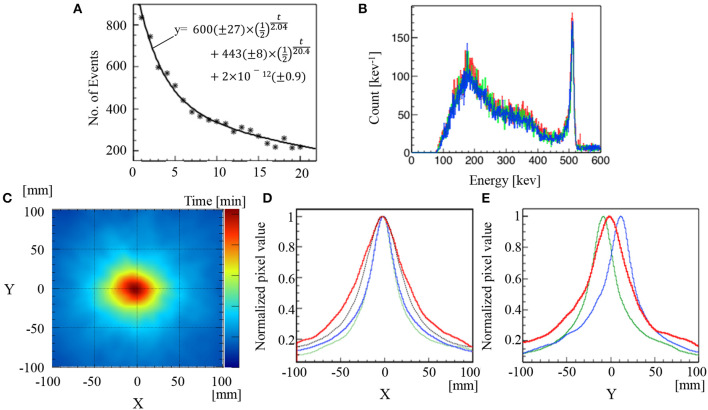
Figure 4.
Results of C-ion beam irradiation on a mouse. Time course of Compton events and numbers in parentheses for fitting parameters are 68% confidence intervals (A). Energy spectra of Na-22 or mouse-irradiation measurement (B). Compton image (C). Normalized profiles of x-projection at y = 0 (red line) (D) and normalized profiles of y-projection at x = 0 (red line) (E). The dotted line in (A) represents a fitting curve following the equivalent equation, as illustrated in (A). The red, green, and blue lines in (B) represent the corresponding spectrum of mouse and Na-22 point source images at the sample stage level and 2 cm above the sample stage level, respectively. The green lines and blue lines in (D) and (E) represent the corresponding profiles of Na-22 point source images at the sample stage level and 2 cm above the sample stage level, respectively. The black dotted line in (D) was the convolution of the PSF (FWHM = 40 mm) determined by the Na-22 image, and the beam profile (FWHM = 24 mm) determined by the Gafchromic film.

