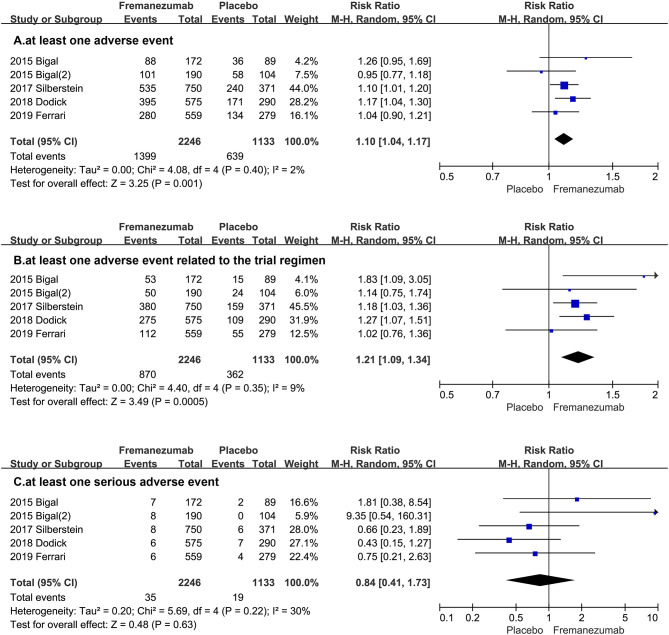
Figure 3.
The pooled RR of adverse events. The blue square indicates the estimated RR for each RCT. The size of blue square indicates the estimated weight of each RCT, and the extending lines indicate the estimated 95% CI of RR for each RCT. The black diamond indicates the estimated RR (95% CI) for all patients together. (A) at least one adverse event. (B) at least one adverse event related to the trial regimen. (C) at least one serious adverse event. CI, confidence interval; RCT, randomized controlled trial; RR: risk ratio.

