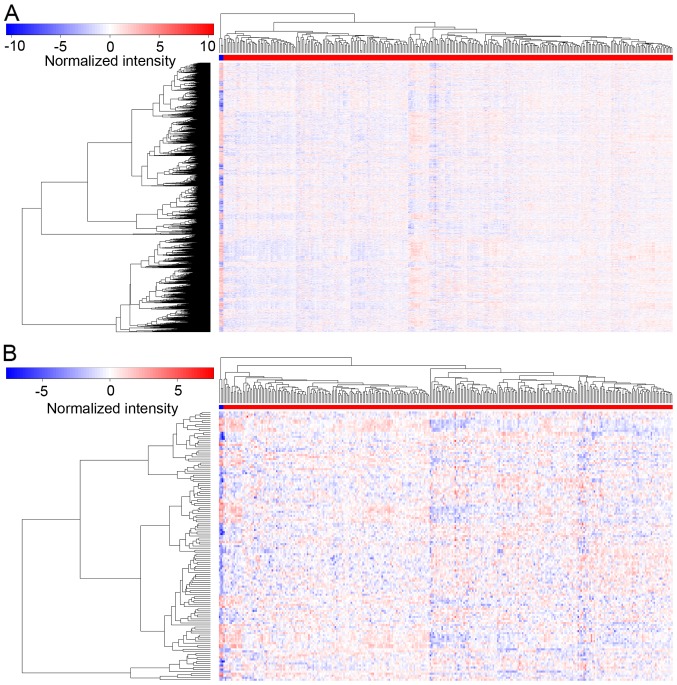
Figure 2.
Heatmap of differentially expressed profiles in CESC. In the heatmap, the blue strip represents normal tissues and the red strip represents tumor tissues. Gradient colors from blue to red indicate genes from low- to high expression. (A) Heatmap of DEmRNAs. A total of 2,255 DEmRNAs were confirmed: 796 DEmRNAs were significantly upregulated, and 1,459 DEmRNAs were downregulated. (B) Heatmap of DEmiRNAs. A total of 133 DEmiRNAs were confirmed: 80 DEmiRNAs were significantly upregulated, and 53 DEmiRNAs were markedly downregulated. CESC, cervical squamous cell carcinoma and endocervical adenocarcinoma; DE, differentially expressed.

