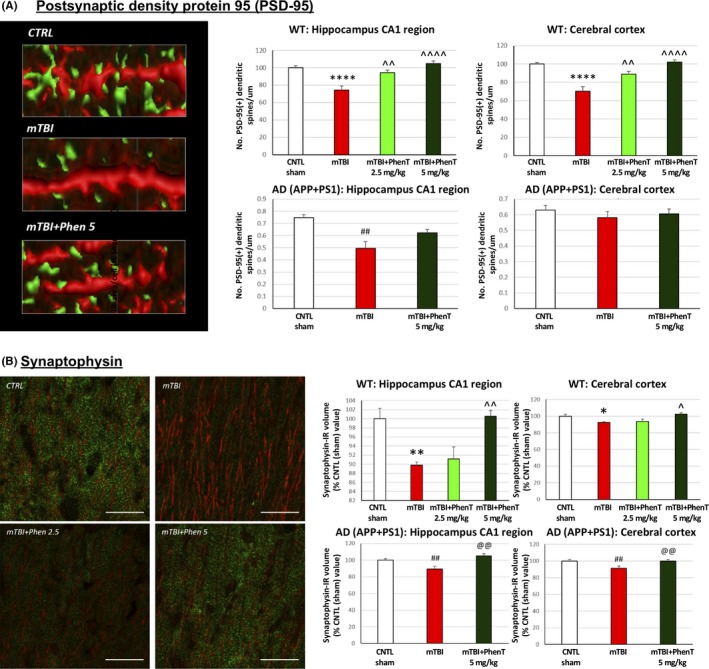
Figure 5.

PhenT mitigates mTBI‐induced reductions in pre‐ and postsynaptic markers of synaptic integrity (72 h post‐mTBI) in both WT and AD mice: A, PSD‐95: mTBI induced a loss of PSD‐95 + dendritic spines across all analyzed areas in WT mice, and in hippocampus of AD mice, vs the sham (CTRL) group. In contrast, PhenT‐treated mTBI mice were not statistically different from the sham (CTRL) group. Specifically, WT mTBI mice treated with PhenT (2.5 and 5 mg/kg) possessed a greater number of PSD‐95 + dendritic spines across both hippocampus and cortex, vs the mTBI vehicle group. Representative images of PSD‐95 + spines (green) in MAP2 + dendrites. Data are expressed as No. of PSD‐95 + dendritic spines/μm. B, Presynaptic synaptophysin: the total volume occupied by synaptophysin immunoreactivity (IR) was quantified across WT and AD (APP/PSEN1) mice and found to be significantly decreased in the mTBI vehicle group, vs the respective sham (CTRL) group. By contrast, mTBI PhenT‐treated animals had levels no different from sham (CTRL) mice. Notably, PhenT treatment resulted in significantly higher levels of synaptophysin IR, vs the mTBI vehicle group, across all analyzed brain areas in both WT and AD mice. n = 5 per group. *P < .05, **P < .01, ****P < .001 vs CTRL by Tukey's post hoc test; ^P < .05, ^^P < .01, ^^^^P < .0001 vs mTBI by Tukey's post hoc test. ##P < .01 vs CTRL by Mann‐Whitney rank test. Data are mean ± SEM values. @@P < .01 vs mTBI by Mann‐Whitney rank test. Scale bar = 20 μm
