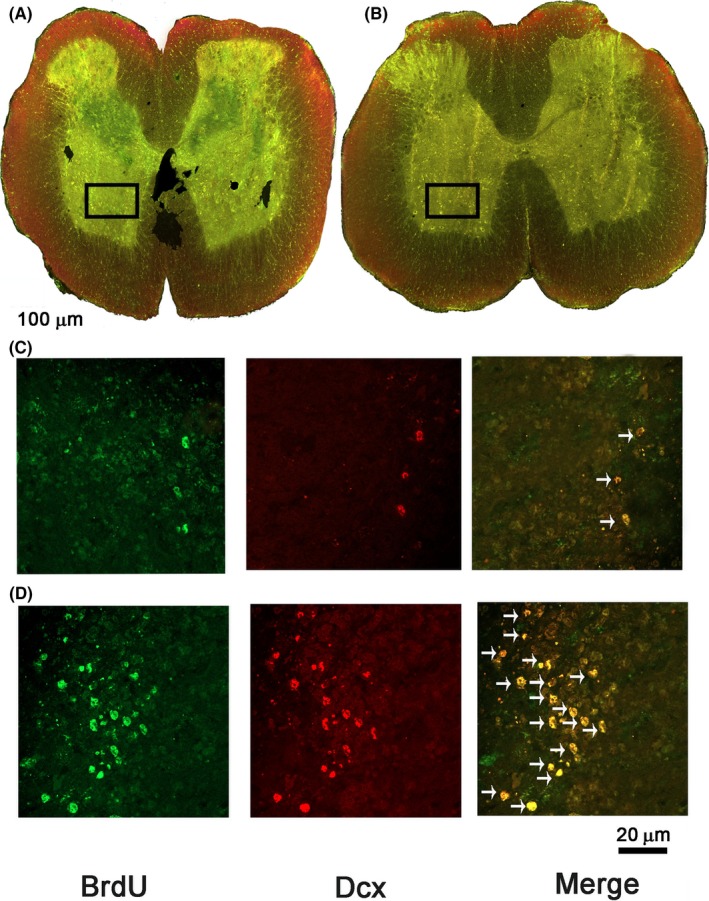
FIGURE 3.

Representative microphotograph of BrdU+/DCX+ cells at the central canal, dorsal and ventral horns, and injury site of SC‐injured rats after therapeutic intervention. A and C correspond to the PBS, while B and D correspond to the INDP group. BrdU+ cells (green), Dcx+ cells (red), and BrdU+/Dcx+ cells (yellow). Black squares depict the amplified areas in C and D panels. Arrows indicate double‐labeled cells (neuroblasts). A greater number of double‐labeled cells were found in the INDP‐treated group
