
FIGURE 6.
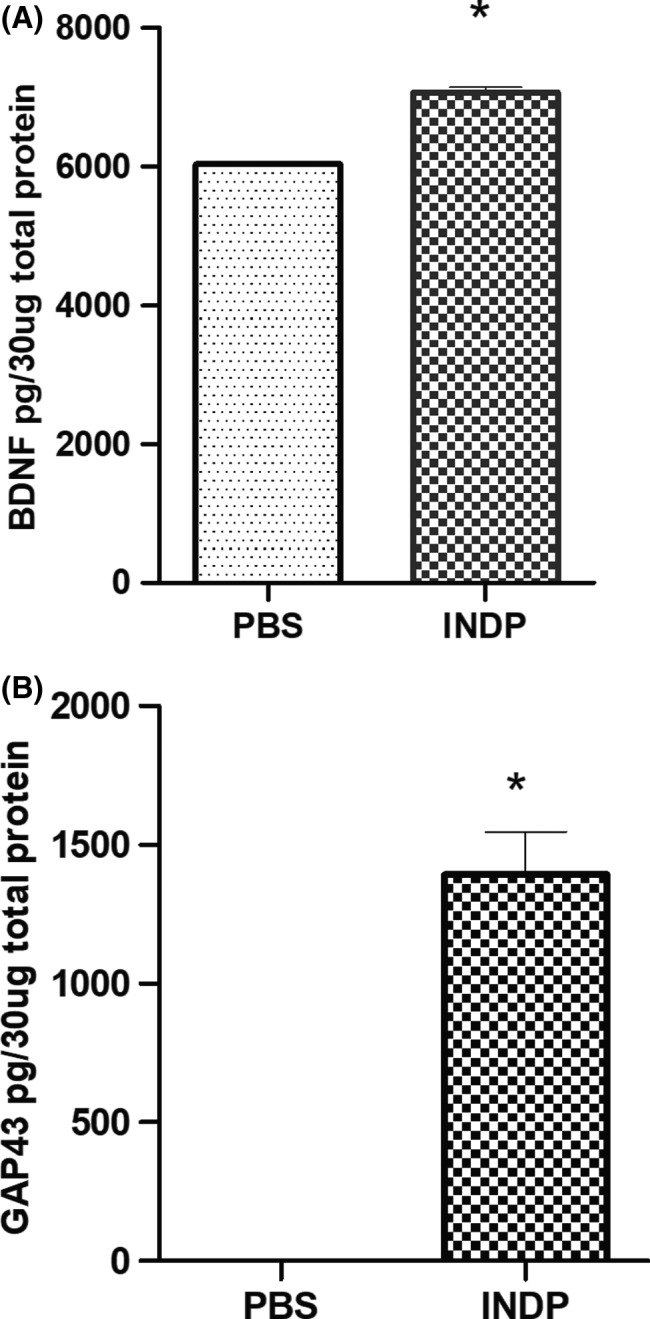
BDNF and GAP‐43 concentrations 120 d after SCI. The levels of BDNF (A) and GAP‐43 (B) in INDP‐treated rats were significantly higher than those observed in the group immunized with PBS alone. Bars represent the mean ± SD of five rats. This is one representative graph of three determinations. *Different from PBS, P < .05; Student's t test