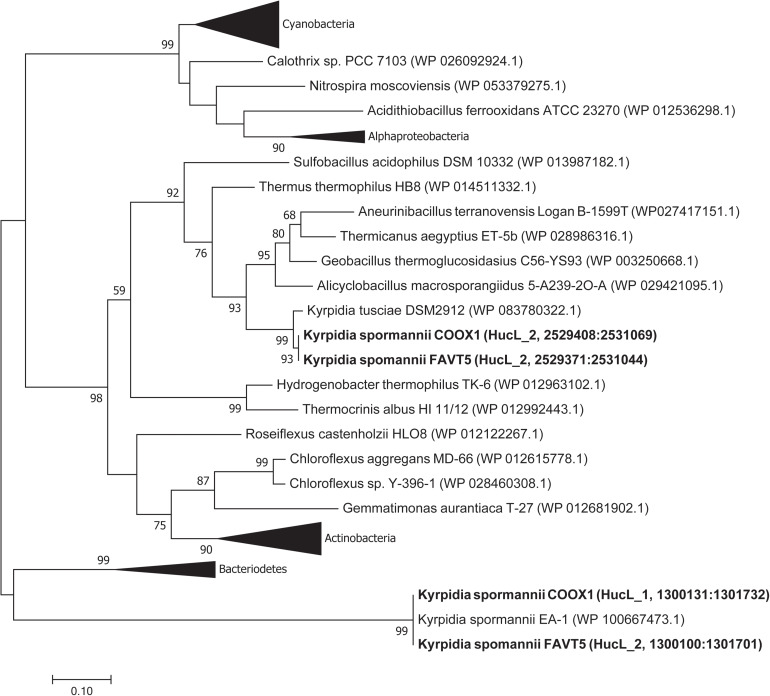
FIGURE 4.
Phylogenetic tree of the group 2a [NiFe] hydrogenases. The tree was constructed using the Maximum Likelihood method (Saitou and Nei, 1987). Bootstrap percentage values above 50% (1000 replicates) are given at each node. Evolutionary distances were calculated using the Poisson correction method (Zuckerkandl and Pauling, 1965). The analysis involved 74 amino acid sequences and was performed using MEGA7 (Kumar et al., 2016).

