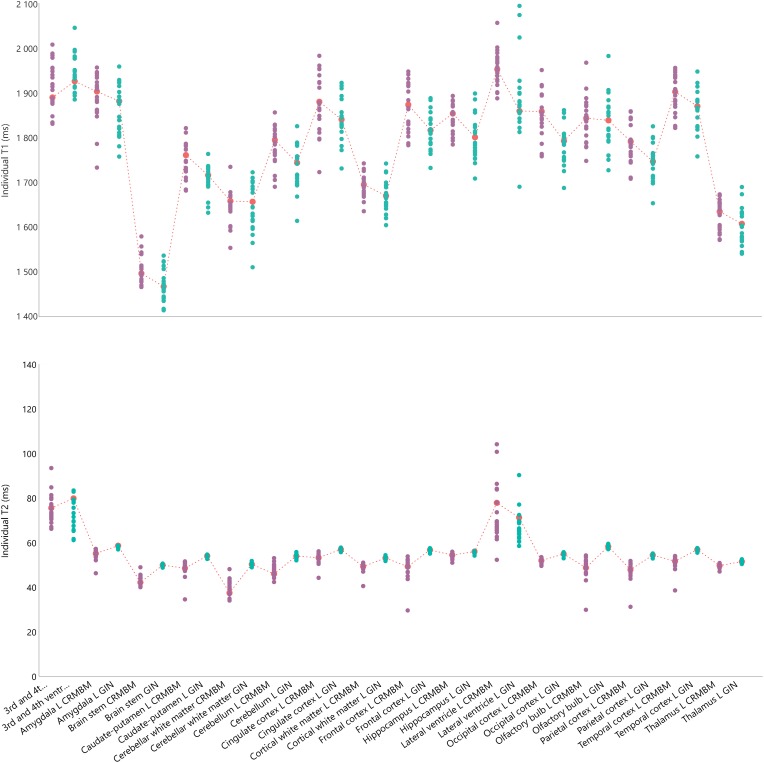
FIGURE 2.
Individual relaxation times for 16 regions of interest for the left hemisphere including 3 regions overlappping the two hemispheres. Top: Individual T1 values. Bottom: Individual T2 values. Green circles for aC1 values; purple circles for aC2 values and corresponding mean values indicated with a red mark and dash-line. The fC1 fitting pipeline and the sC4 multi-atlas segmentation were used.

