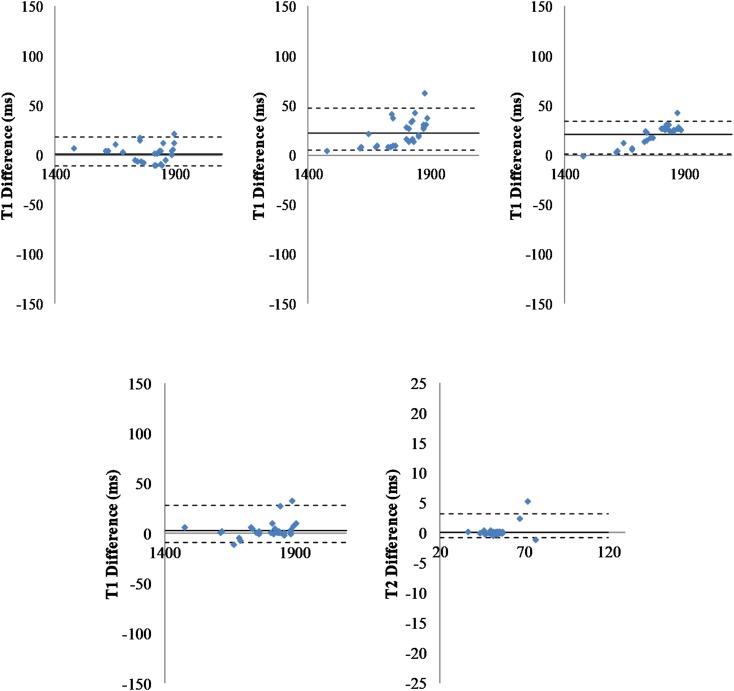
FIGURE 3.
Comparison of pipelines. Top: Fitting pipelines. Bland-Altman representation of difference between T1 relaxation times for all regions of interest (n = 29), averaged across all animals (n = 40) and obtained with three different fitting pipelines. Left: T1 differences for fC1 minus fC2; Middle: T1 differences for fC1 minus fC3; Right: T1 differences for fC2 minus fC3. The sC4 was used for segmentation. Solid line: Mean difference. Dash-lines: ± two standard deviations. Bottom: Segmentation pipelines: Bland-Altman graph of the T1 (left) and T2 (right) differences measured for all regions of interest (n = 29), averaged all animals (n = 40) and obtained with two different segmentation pipelines (one point per region of interest). The fC1 fitting pipeline was used. Solid line: mean difference. Dash-lines: ± two standard deviations.

