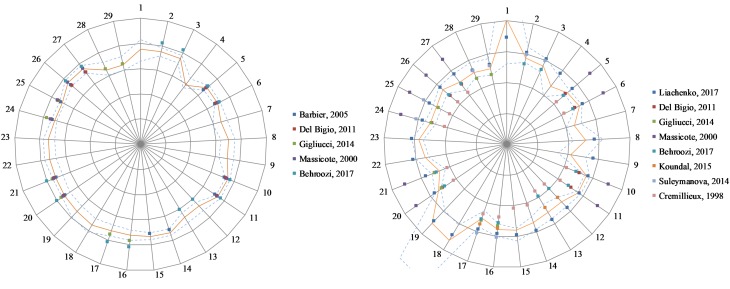
FIGURE 4.
Relaxation values for this study and five published studies (see References list for details) in 29 regions of interest. Left: T1 relaxation values. Scale: 500 ms/division. Right: T2 relaxation. Scale: 15 ms/division. The orange line indicates results from this study. Dash lines indicate ± one standard deviation from our results. 1: 3rd and 4th ventricles, 2: Amygdala L, 3: Amygdala R, 4: Brain stem, 5: Caudate-putamen L, 6: Caudate-putamen R, 7: Cerebellar white matter, 8: Cerebellum L, 9: Cerebellum R, 10: Cingulate cortex L, 11: Cingulate cortex R, 12: Cortical white matter L, 13: Cortical white matter R, 14: Frontal cortex L, 15: Frontal cortex R, 16: Hippocampus L, 17: Hippocampus R, 18: Lateral ventricle L, 19: Lateral ventricle R, 20: Occipital cortex L, 21: Occipital cortex R, 22: Olfactory bulb L, 23: Olfactory bulb R, 24: Parietal cortex L, 25: Parietal cortex R, 26: Temporal cortex L, 27: Temporal cortex R, 28: Thalamus L, 29: Thalamus R.

