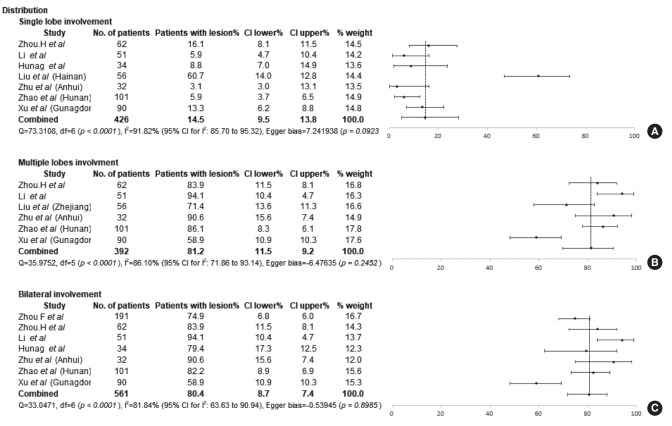
Fig. 5.
The proportions of the distribution of pathologic findings observed on chest computed tomography in patients with coronavirus disease 2019 (COVID-19) [33-41]. The proportions of single lobe involvement (A), multiple lobe involvement (B), and bilateral lung involvement (C). CI, confidence interval.

