Figure 2.

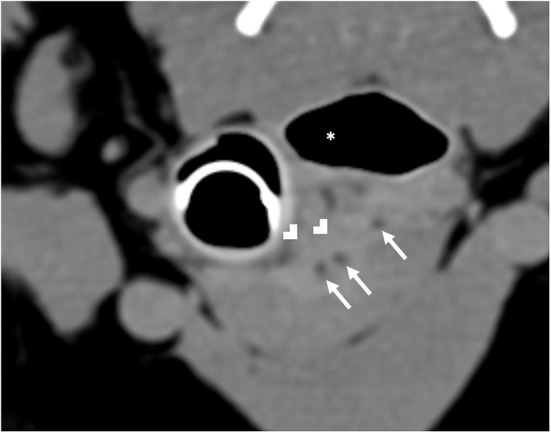
Computed tomography of hyperattenuating soft tissue (white chevrons) representing the fistulous tract that is contiguous with the esophagus (white asterisk). Within the fistulous tract there are small gas bubbles (white arrows).

Computed tomography of hyperattenuating soft tissue (white chevrons) representing the fistulous tract that is contiguous with the esophagus (white asterisk). Within the fistulous tract there are small gas bubbles (white arrows).