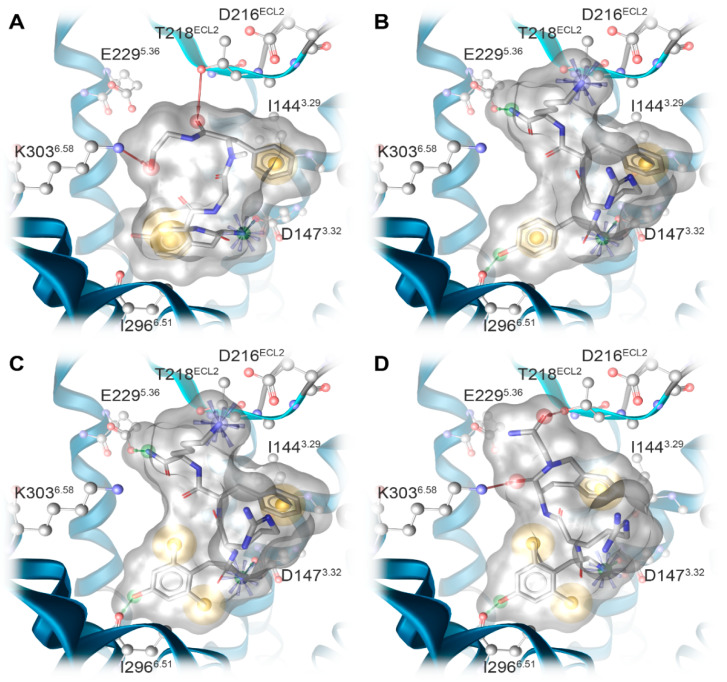
Figure 6.
Predicted binding modes at the human MOR model (based on PDB ID: 6DDF) and receptor–ligand interaction patterns of opioid peptides (A) DAMGO, (B) DALDA, (C) [Dmt1]DALDA, and (D) KGOP01. Yellow spheres indicate lipophilic contacts, red arrows hydrogen bond acceptors, green arrows hydrogen bond donors, and positively charged centers are shown as blue spheres.

