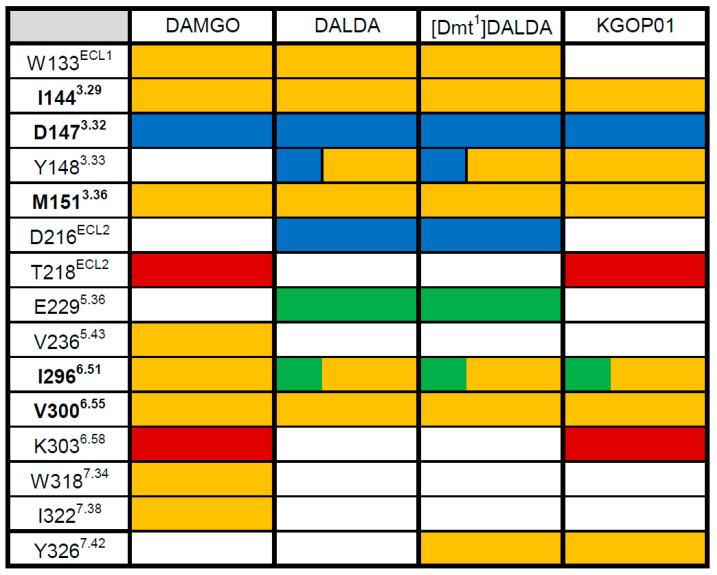
Figure 7.
Ligand–MOR interaction pattern derived from molecular docking solutions of opioid peptides DAMGO, DALDA, [Dmt1]DALDA, and KGOP01. Yellow fields indicate lipophilic contacts, red fields hydrogen bond acceptors, green fields hydrogen bond donors, and positively charged centers are shown as blue fields. White fields indicate the absence of an interaction with that residue. Residues which show the same type of interaction for all morphinan ligands are marked in bold.

