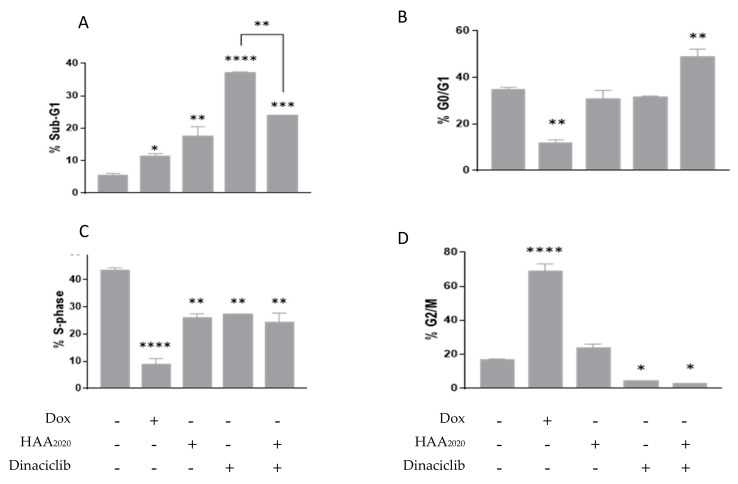
Figure 4.
Cell cycle analysis in HL60 cells. Cells were treated (+) for 24 h with either 100 nM doxorubicin (Dox), 500 nM HAA2020, 10 nM dinaciclib or a combination of HAA2020 and dinaciclib (500 nM and 10 nM, respectively). Data are represented as mean ± SEM (n = 2, two independent experiments) for each of the phases of the cell cycle, sub-G1 (A), G0/G1 (B), S (C) and G2/M (D). Statistical differences, compared with the untreated control cells (-), were assessed by a one-way ANOVA with the Tukey’s post-hoc multiple comparison test (GraphPad Prism). p < 0.05 (*), p < 0.01 (**), p < 0.001 (***) and p < 0.0001 (****) were taken as significant.

