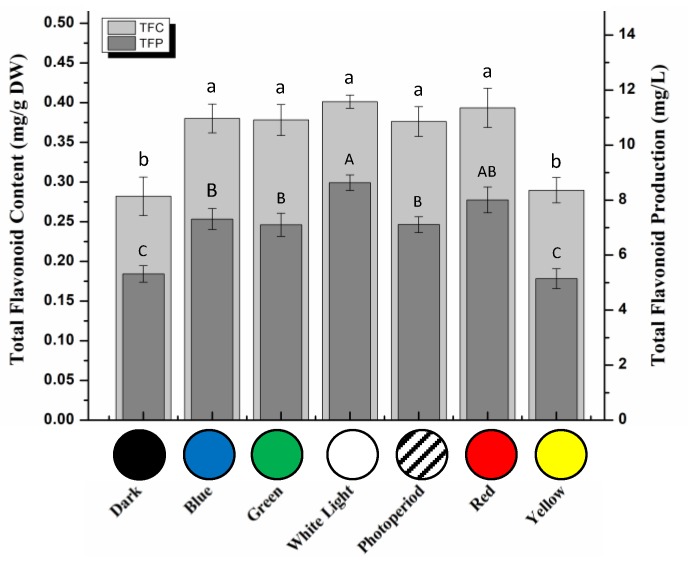
Figure 5.
Total flavonoid content (TFC) and total flavonoid production (TFP) in callus cultures kept under different monochromatic lights. Data are expressed in terms of mean ± SD of at least three independent experiments. Different letters indicate significant differences between conditions (p < 0.05).

