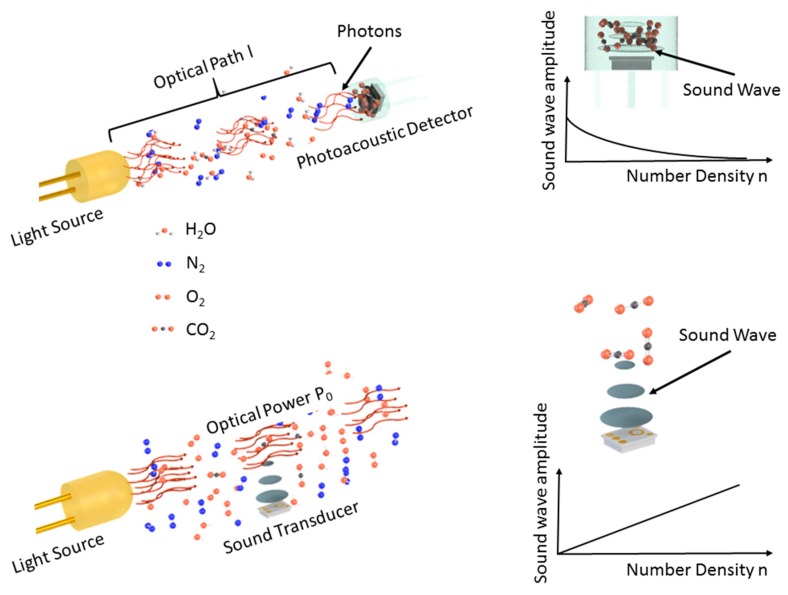
Figure 2.
A schematic to compare the most basic direct (bottom) and indirect (top) photoacoustic spectroscopy setups. (Top-left) A photoacoustic detector is employed to determine the light intensity. The sensitivity is adjusted via the optical path length l and the detected acoustic signal diminished with an increasing number density of the gas to be detected (top-right). (Bottom-left) The sensitivity may be adjusted via the optical power P0 employed to excite the molecules. The acoustic signal increases with an increasing number density of the target gas (bottom-right).

