Figure 5.
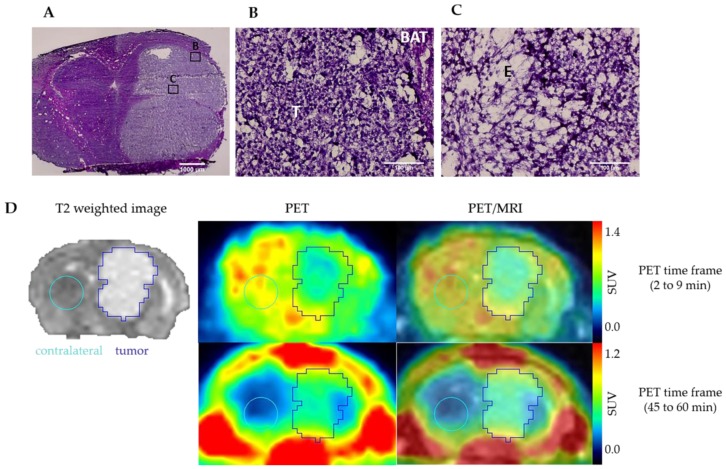
Hematoxylin-eosin staining of U87-MG tumour: (A) tumour bulk in the right striatum of a mouse brain (×2, scale bar: 1000 µm); (B) tumour periphery presents area of high density of cell nuclei; (C) tumour centre presents area of lower cell density accompanied by oedema. (×40, BAT: brain adjacent to tumour; T: tumour, E: oedema. Scale bar: 100 µm. (D) Representatives coronal PET/MR images of U87-MG tumour-bearing mouse after i.v. administration of (S)-(−)-[18F]fluspidine. The upper panel exhibits the distribution of (S)-(−)-[18F]fluspidine at early times p.i. (averaged time frames from 2 to 9 min), and the lower panel exhibits the distribution of (S)-(−)-[18F]fluspidine at later times (averaged time frames from 45 to 60 min).

