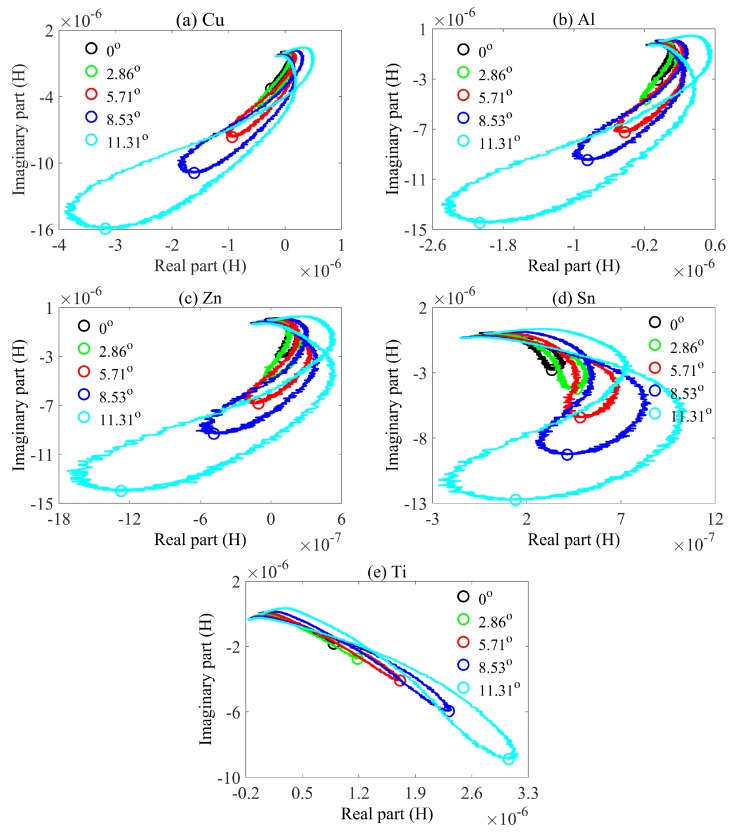
Figure 4.
Measured mutual inductances in the form of real part and imaginary part for tilting samples. (a) Cu. (b) Al. (c) Zn. (d) Sn. (e) Ti. black line denotes , green line denotes , red line denotes , blue line denotes , cyan line denotes . Circles are the points corresponding to characteristic phases.

