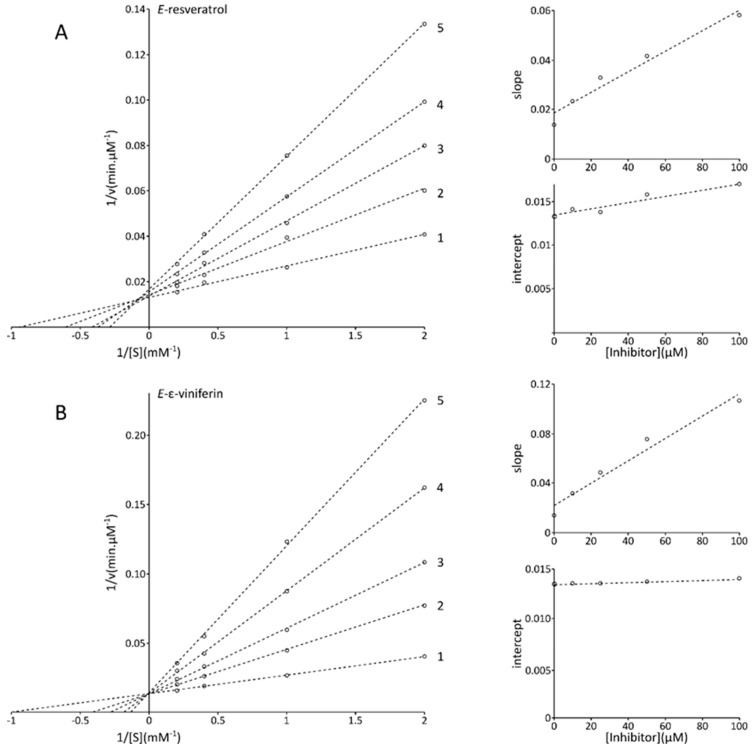
Figure 4.
Lineweaver–Burk plots for inhibition of mushroom tyrosinase by E-resveratrol (A) and E-ε-viniferin (B). Concentrations of E-resveratrol (A) and E-ε-viniferin for curves 1–5 were 0, 10, 25, 50 and 100 µM, respectively. The inset represents the secondary plots representing slopes of the double reciprocal plot versus the concentrations of each inhibitor (i.e., E-resveratrol (A) and E-ε-viniferin (B)) used for the determination of KI and secondary plot of intercepts of the double reciprocal plot versus the concentrations of each inhibitor (i.e., E-resveratrol (A) and E-ε-viniferin (B)) used for the determination of KIS.

