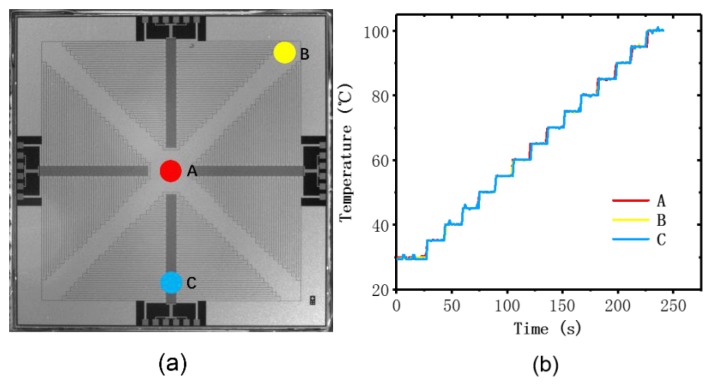
Figure 8.
Heating uniformity experiment by monitoring three places on the PCR thermal control chip. (a) The positions at which the temperature was monitored: in the middle (red, A) and at the edges (yellow and blue, B and C). (b) The temperature traces of the three monitoring points measured by PT100.

