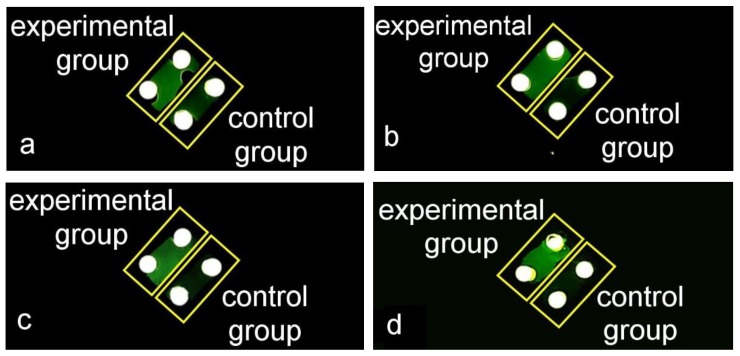
Figure 12.
The results of amplifying HPV16E6 genomic DNA samples in different initial concentrations. The top-left chambers were the experimental groups and the bottom-right chambers were the control groups. (a) The results of amplifying DNA sample 1. (b) The results of amplifying DNA sample 2. (c) The results of amplifying DNA sample 3. (d) The results of amplifying DNA sample 4.

