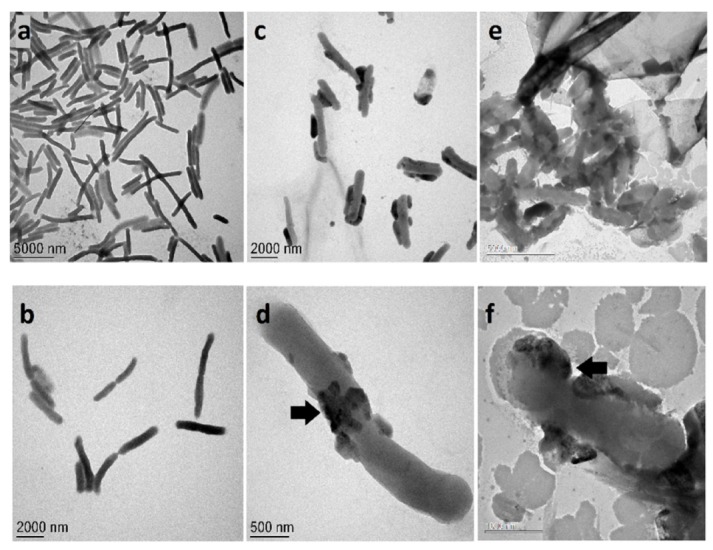
Figure 8.

TEM images of the interaction between E. coli and PchNPs. (a,b): control, (c–f): E. coli treated with PchNPs (c,d: 0,12 nM and e,f: 0,25 nM). Black arrows indicate cell membrane puncturing. Panel f shows a significant amount of debris from cell lysis in addition to the bacterial cells.
