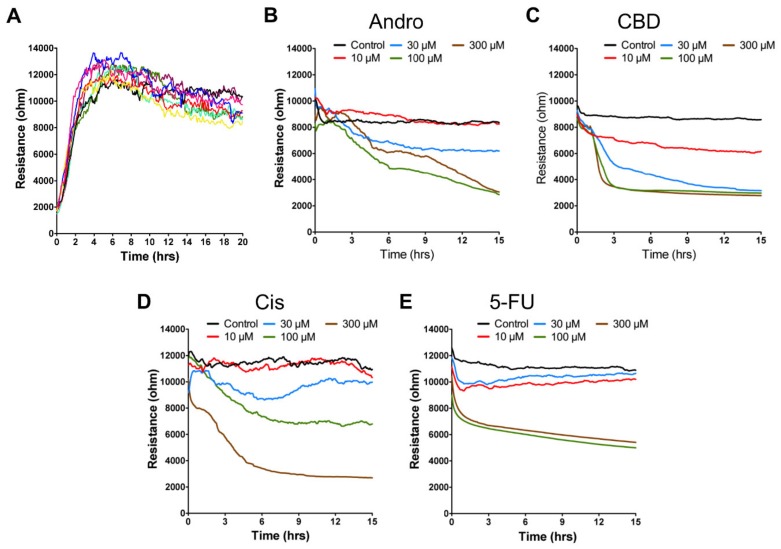
Figure 2.
(A) Resistance time series of SCC-25 cell attachment and spreading. Each colored curve represents the time course obtained from each of the eight electrode-containing wells. Typical resistance time course of confluent SCC-25 cell layers upon addition of various concentrations of (B) andrographolide, (C) CBD, (D) 5-FU, and (E) cisplatin. Three independent ECIS experiments were performed (n = 3). In each experiment, three wells were measured for each drug concentration. At time 0, each anticancer compound dissolved in DMSO was added to give the final concentrations of 10 μM (red), 30 μM (blue), 100 μM (green), 300 μM (brown), and control (black), and the resulting changes in resistance were followed. Data were collected for 15 h after adding for each compound.

