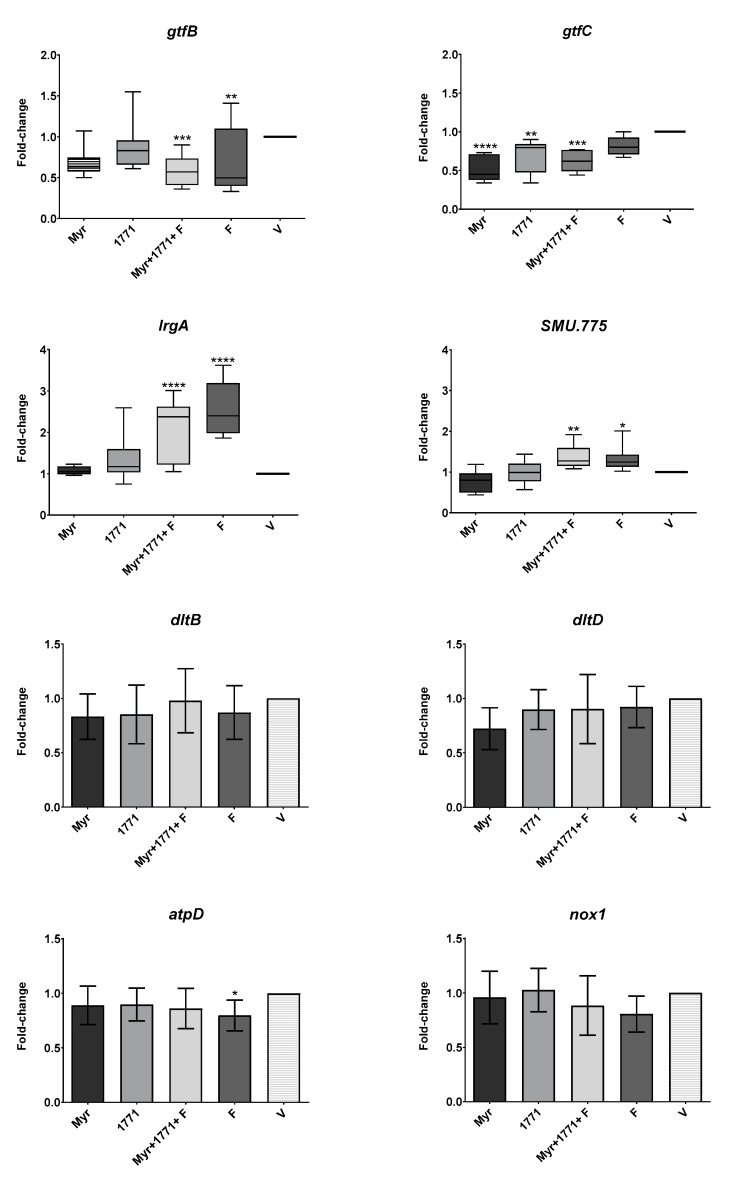
Figure 10.
Gene expression profile of S. mutans biofilms after topical treatments. The fold-change is relative to vehicle-treated biofilms. Data presented are median and interquartile range are shown for genes gtfB, gtfC, IrgA, and SMU.775 (box plot graphs, Kruskal–Wallis test, followed by Dunn post-test), while mean and standard deviation for genes dltB, dltD, atpD, and nox1 (bar graphs; one-way ANOVA, followed by Tukey’s test). The asterisks depict significant statistical differences of treatments versus the vehicle, where * p ≤ 0.05, ** p ≤ 0.01, *** p ≤ 0.001, and **** p ≤ 0.0001. The data were obtained from three experiments (with two cDNA per experiment), and the quantification of qPCR expression was performed in duplicate.

