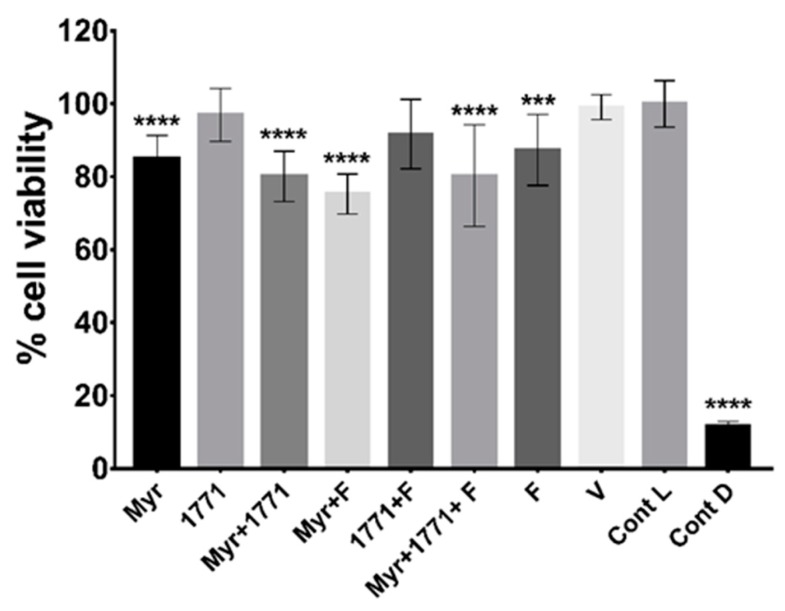
Figure 11.
Cell viability of keratinocytes NOK-si after exposure to treatments. The data represented are the means, and the error bars correspond to the standard deviation “Cont L” indicates cell viability control and “Cont D”, the cell death control. The percentage of cell viability was obtained considering the cell viability control as 100%. The asterisks denote a statistically significant difference of a specific extract versus cell viability control (Cont L), where **** p < 0.0001 and *** p = 0.0005 (one-way ANOVA, followed by Tukey’s test).

