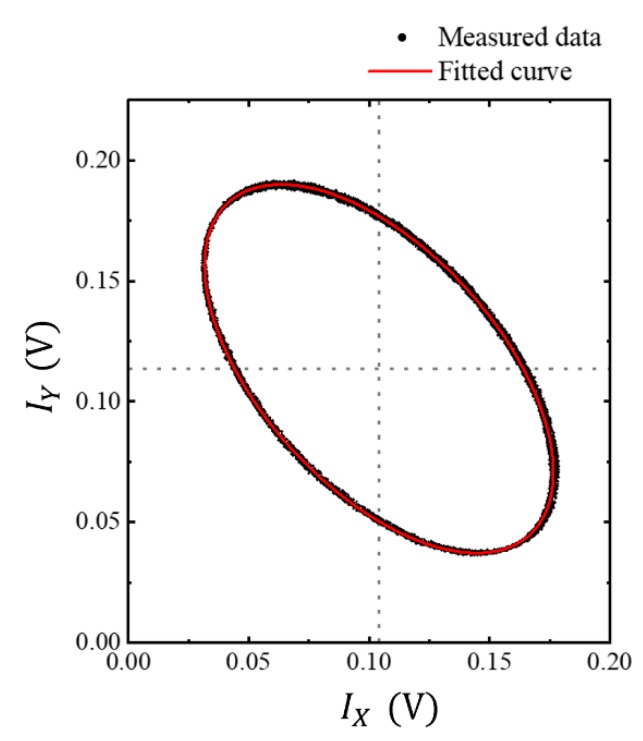
Figure 4.
Lissajous trajectories of the data sets measured simultaneously at two photodetectors, with the OPD change in a 3 × 3 fiber-optic coupler-based interferometer. The trajectories of the data sets correspond to 10 revolutions. The measured data points are indicated by black dots and the red solid line is the fitted ellipse curve.

