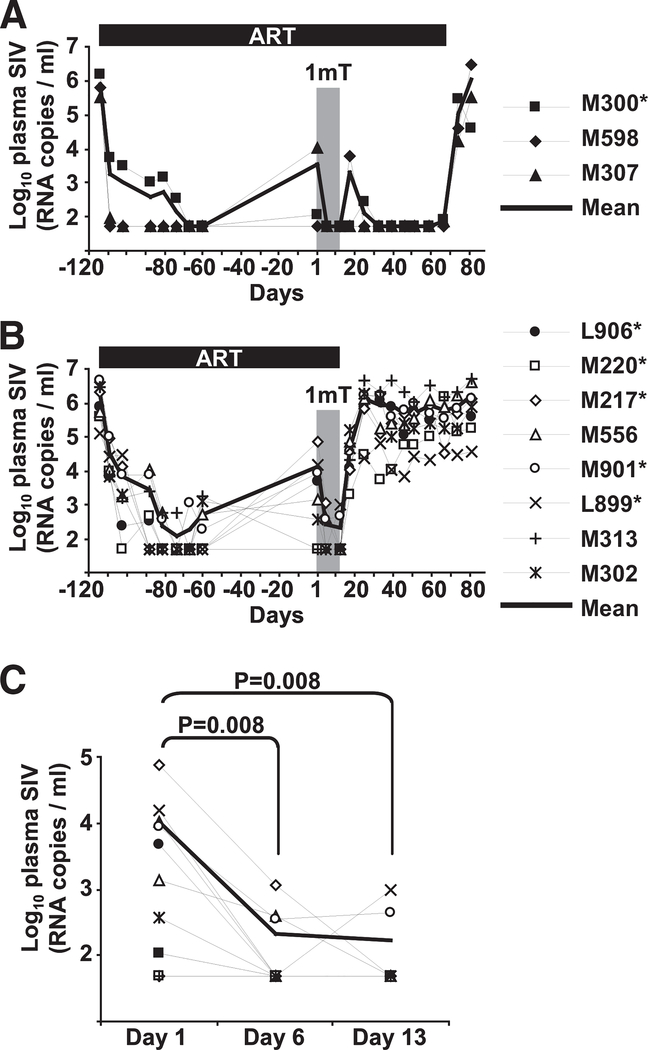
FIGURE 2.
Plasma virus levels in ART-treated SIV-infected macaques receiving D-1mT. A and B, Plasma virus levels recorded from before initiation of ART until after ART interruption are shown for all animals in group 1 (A) and group 2 (B). Each animal is represented by a symbol according to the legends; the thick solid lines represent the arithmetic means. Bars on top of graphs indicate duration of ART treatment. Gray shaded boxes indicate the period of D-1mT administration. C, Detail of plasma virus levels changes in each animal during the period of D-1mT administration. Each animal is represented by a symbol according to the legends on the right of A and B; the thick line represents the mean values among all animals at each time point. Mamu*A-01+ animals are marked by asterisks in the legends.

