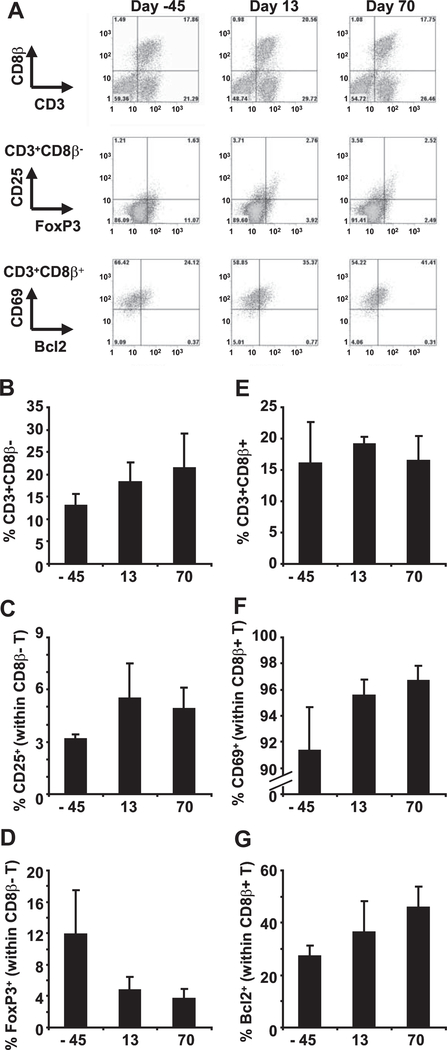
FIGURE 5.
Analysis of lymph node CD4 and CD8 T lymphocytes from ART-treated SIV-infected macaques receiving D-1mT. A, Flow cytometry dot plots showing staining for CD3/CD8β (upper panels), FoxP3/CD25 on gated CD4 T cells (middle panels), and Bcl2/CD69 on gated CD8 T cells (lower panels) on lymph node leukocytes isolated 45 days before and at the end of D-1mT administration (day 13), as well as before ART interruption (day 70) from one example animal (M307) from group 1. B–G, Frequency of CD4 T cells (CD3+CD8β−) on total leukocytes (B), CD25+ among CD4 T cells (C), FoxP3+ among CD4 T cells (D), CD8 T cells (CD3+CD8β+) on total leukocytes (E), CD69+ among CD8 T cells (F), and Bcl2+ among CD8 T cells (G) in lymph node leukocytes of ART-treated SIV-infected macaques. Mean values ± SD are shown in B–G. Lymph nodes were excised 45 days before and at the end of D-1mT administration (day 13) from animals in both groups 1 and 2, as well as before ART interruption (day 70) from animals in group 1.

