
Figure 2:
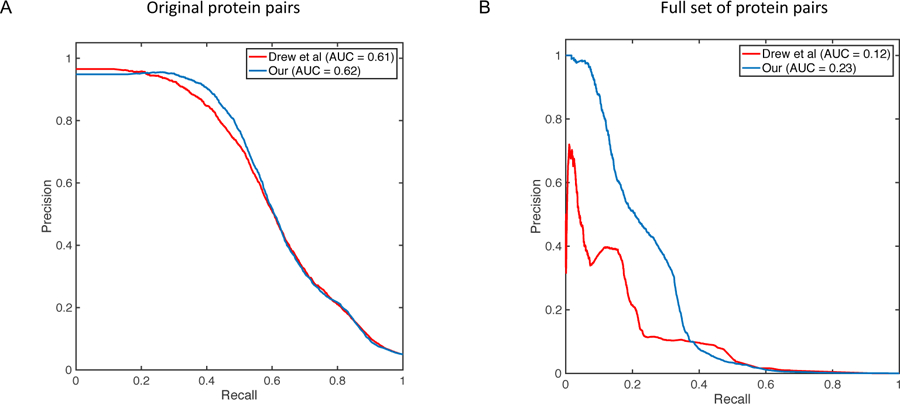
Performance comparison of pairwise protein interactions prediction. Figure shows precision-recall curve and area under the curve (AUC) of our proposed method (blue) compared against a previously published approach by Drew et al [7] (red). (A) Figure shows the comparison results for the original test set of protein pairs in [7]. (B) Figure shows the comparison results on the full set of protein pairs for which we had data.