
Figure 6.
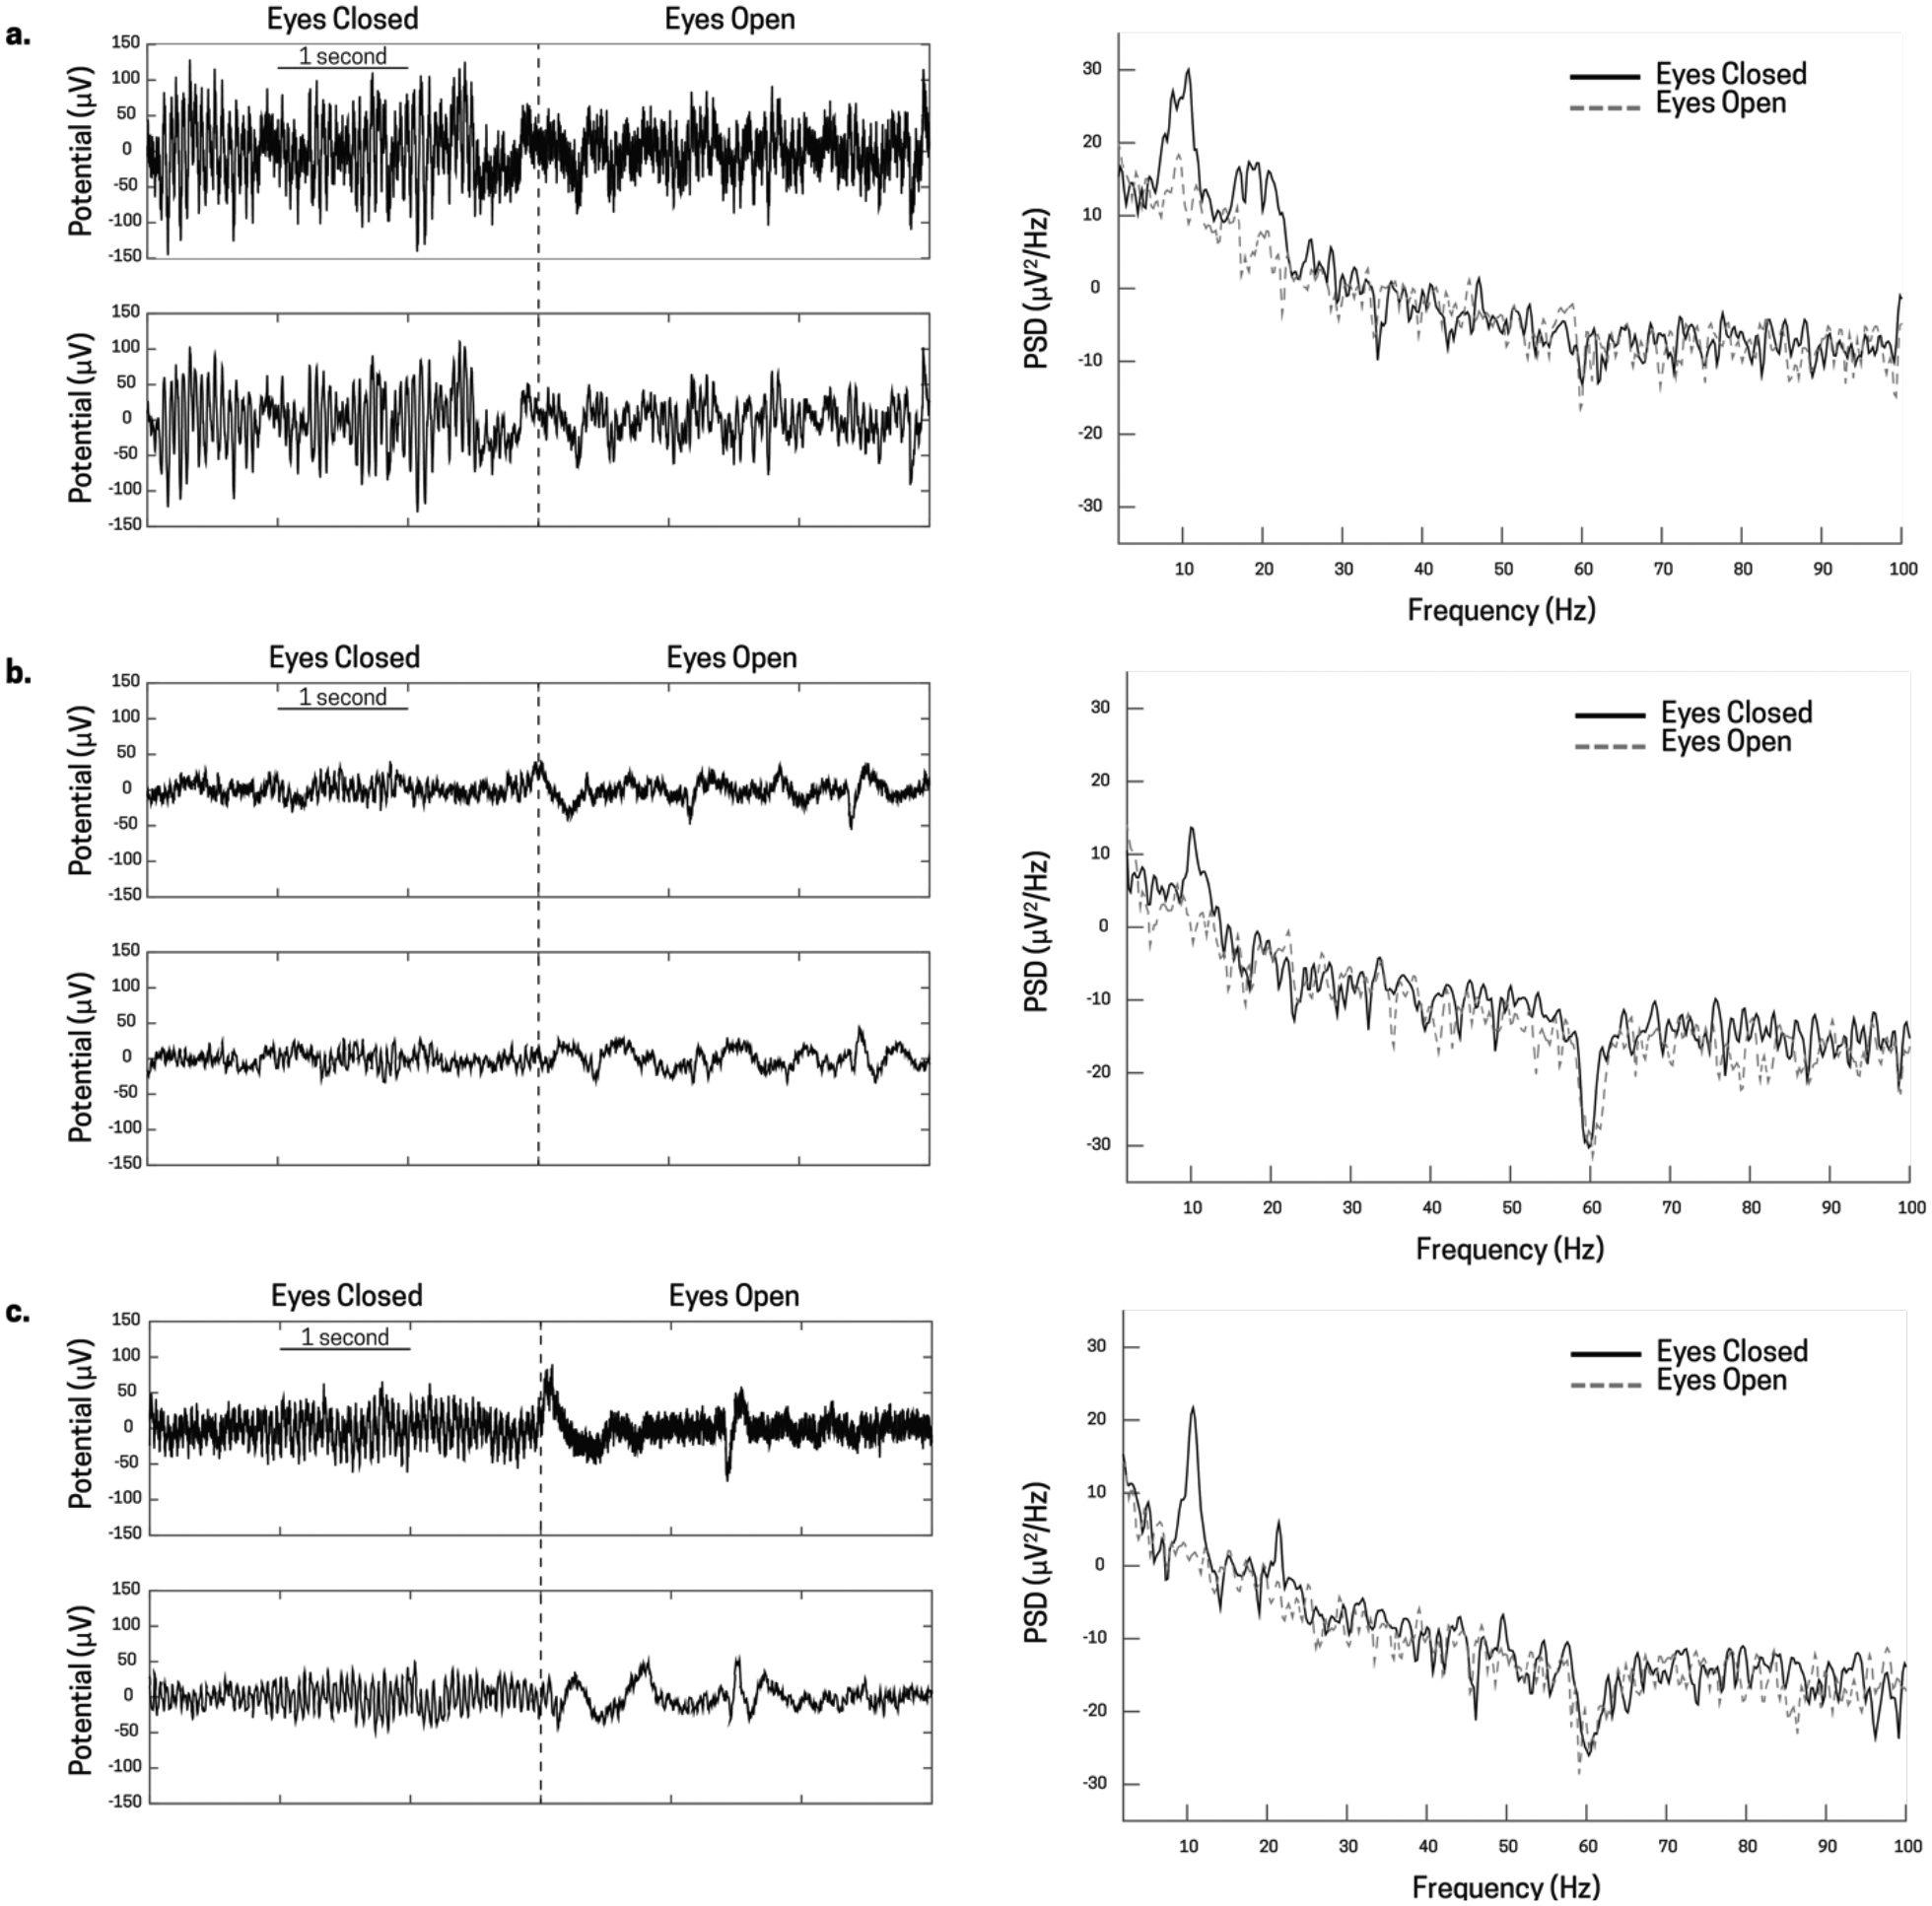
Occipital alpha band activity from three different subjects, a), b), and c) taken from the Pz electrode during an alert (eyes open) and a rest (eyes closed) state. The top left plot for a, b, and c are the raw, unfiltered voltage traces of the transition state for eyes closed to eyes open (denoted by the dotted black line). The bottom left plot for a, b, and c are the filtered voltage traces (0.1–100 Hz band-pass, 60 Hz notch) that show a slight reduction in power, but still strong presence of alpha band activity. Finally, the right plot for a, b, and c show the power spectral density plots of eyes open (dotted grey line) and eyes closed (solid black line) states. There is a prevalent alpha peak (around 10 Hz) for each individual in the eyes closed state, and a strong reduction in alpha power in the eyes open state.