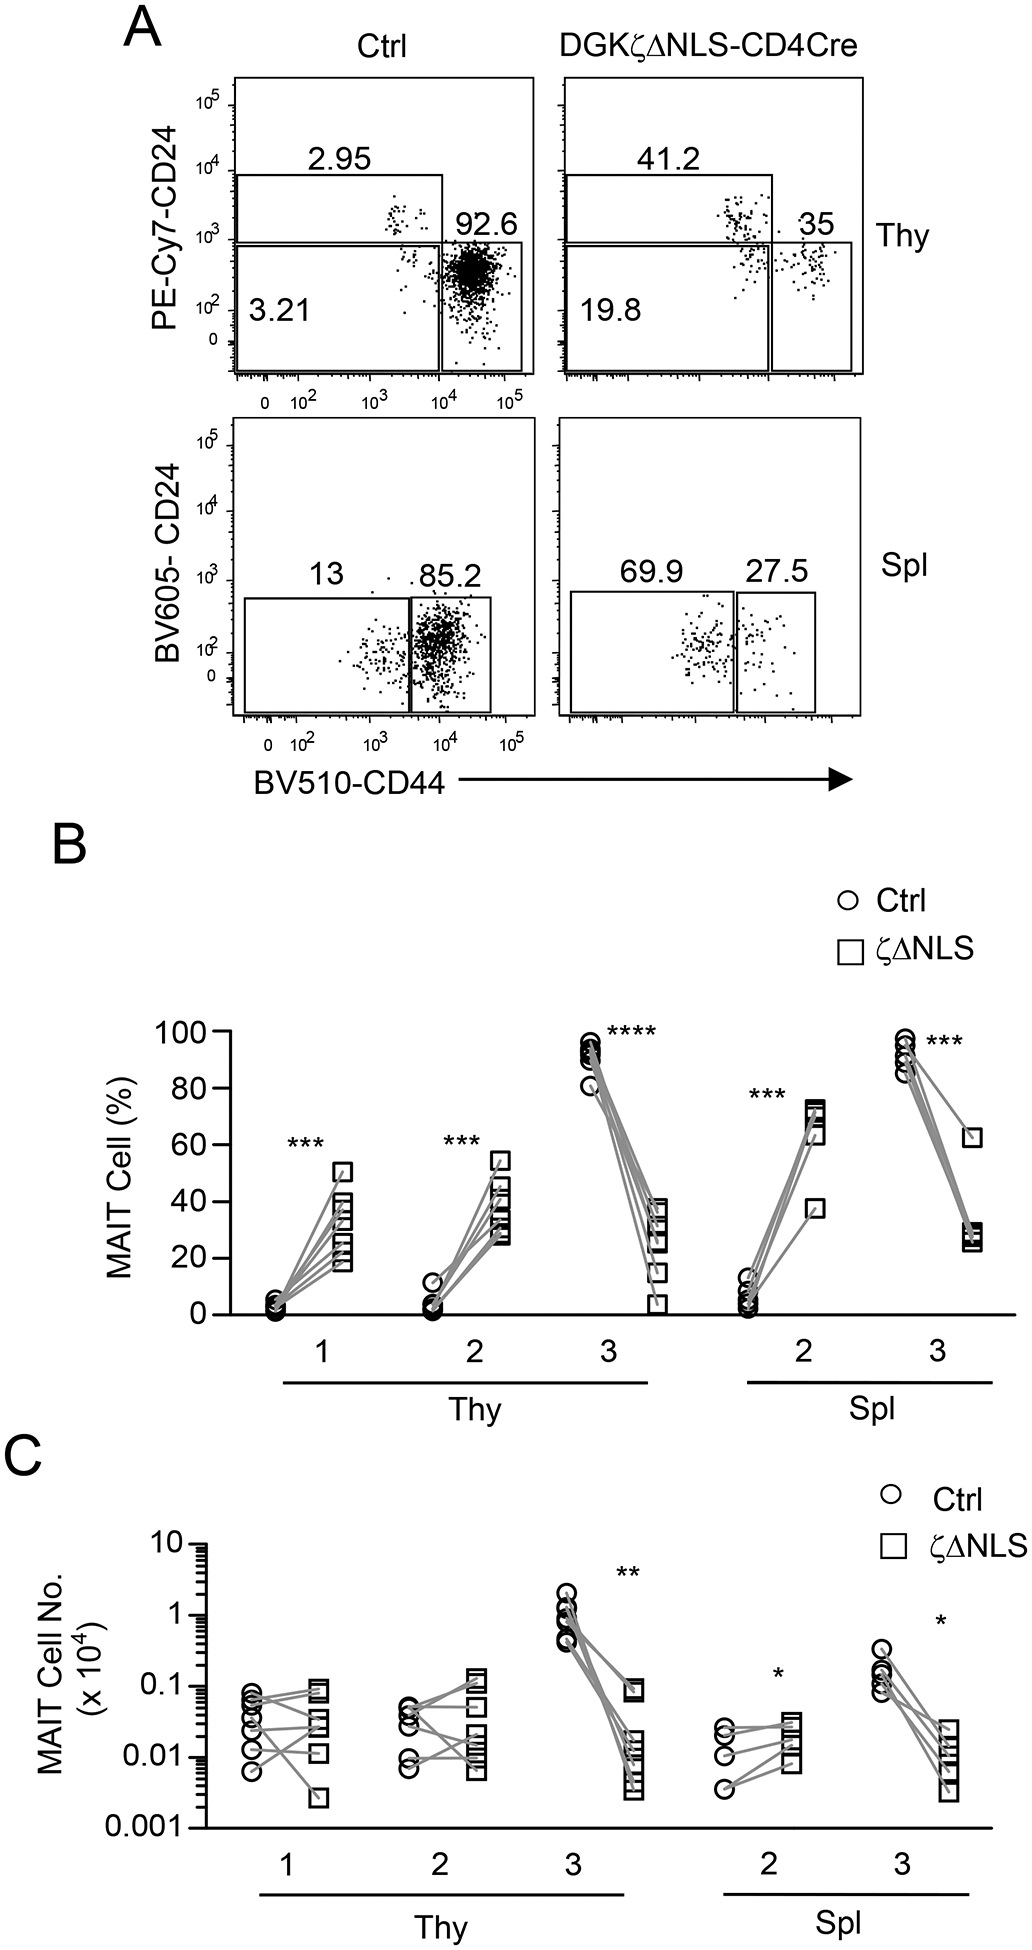
Figure 3. DAG-mediated signaling is important for MAIT cell maturation/maintenance.

Thymocytes and splenocytes from GFP-DgkzΔNLS-Cd4Cre and control mice were enriched for and then were stained for MAIT cells as shown in Figure 1 with the addition of anti-CD24 and -CD44 antibodies. A. Representative dot plots show CD24 and CD44 expression in live gated Lin− TCRβ+MR1-Tet+ MAIT cells. Data shown are representative of at least five experiments. B, C. Scatter plots show stage 1 (CD24+CD44−), stage 2 (CD24−CD44−), and stage 3 (CD24−CD44+) MAIT cell percentages (B) and numbers (C). Data shown are pooled from seven experiments for thymus and five experiments for spleen. N = 7 for thymus and N = 5 for spleen for both test and control mice. *, p<0.05; **, p<0.01; ***, p<0.001; ****, p<0.0001 determined by pairwise Student t-test.
