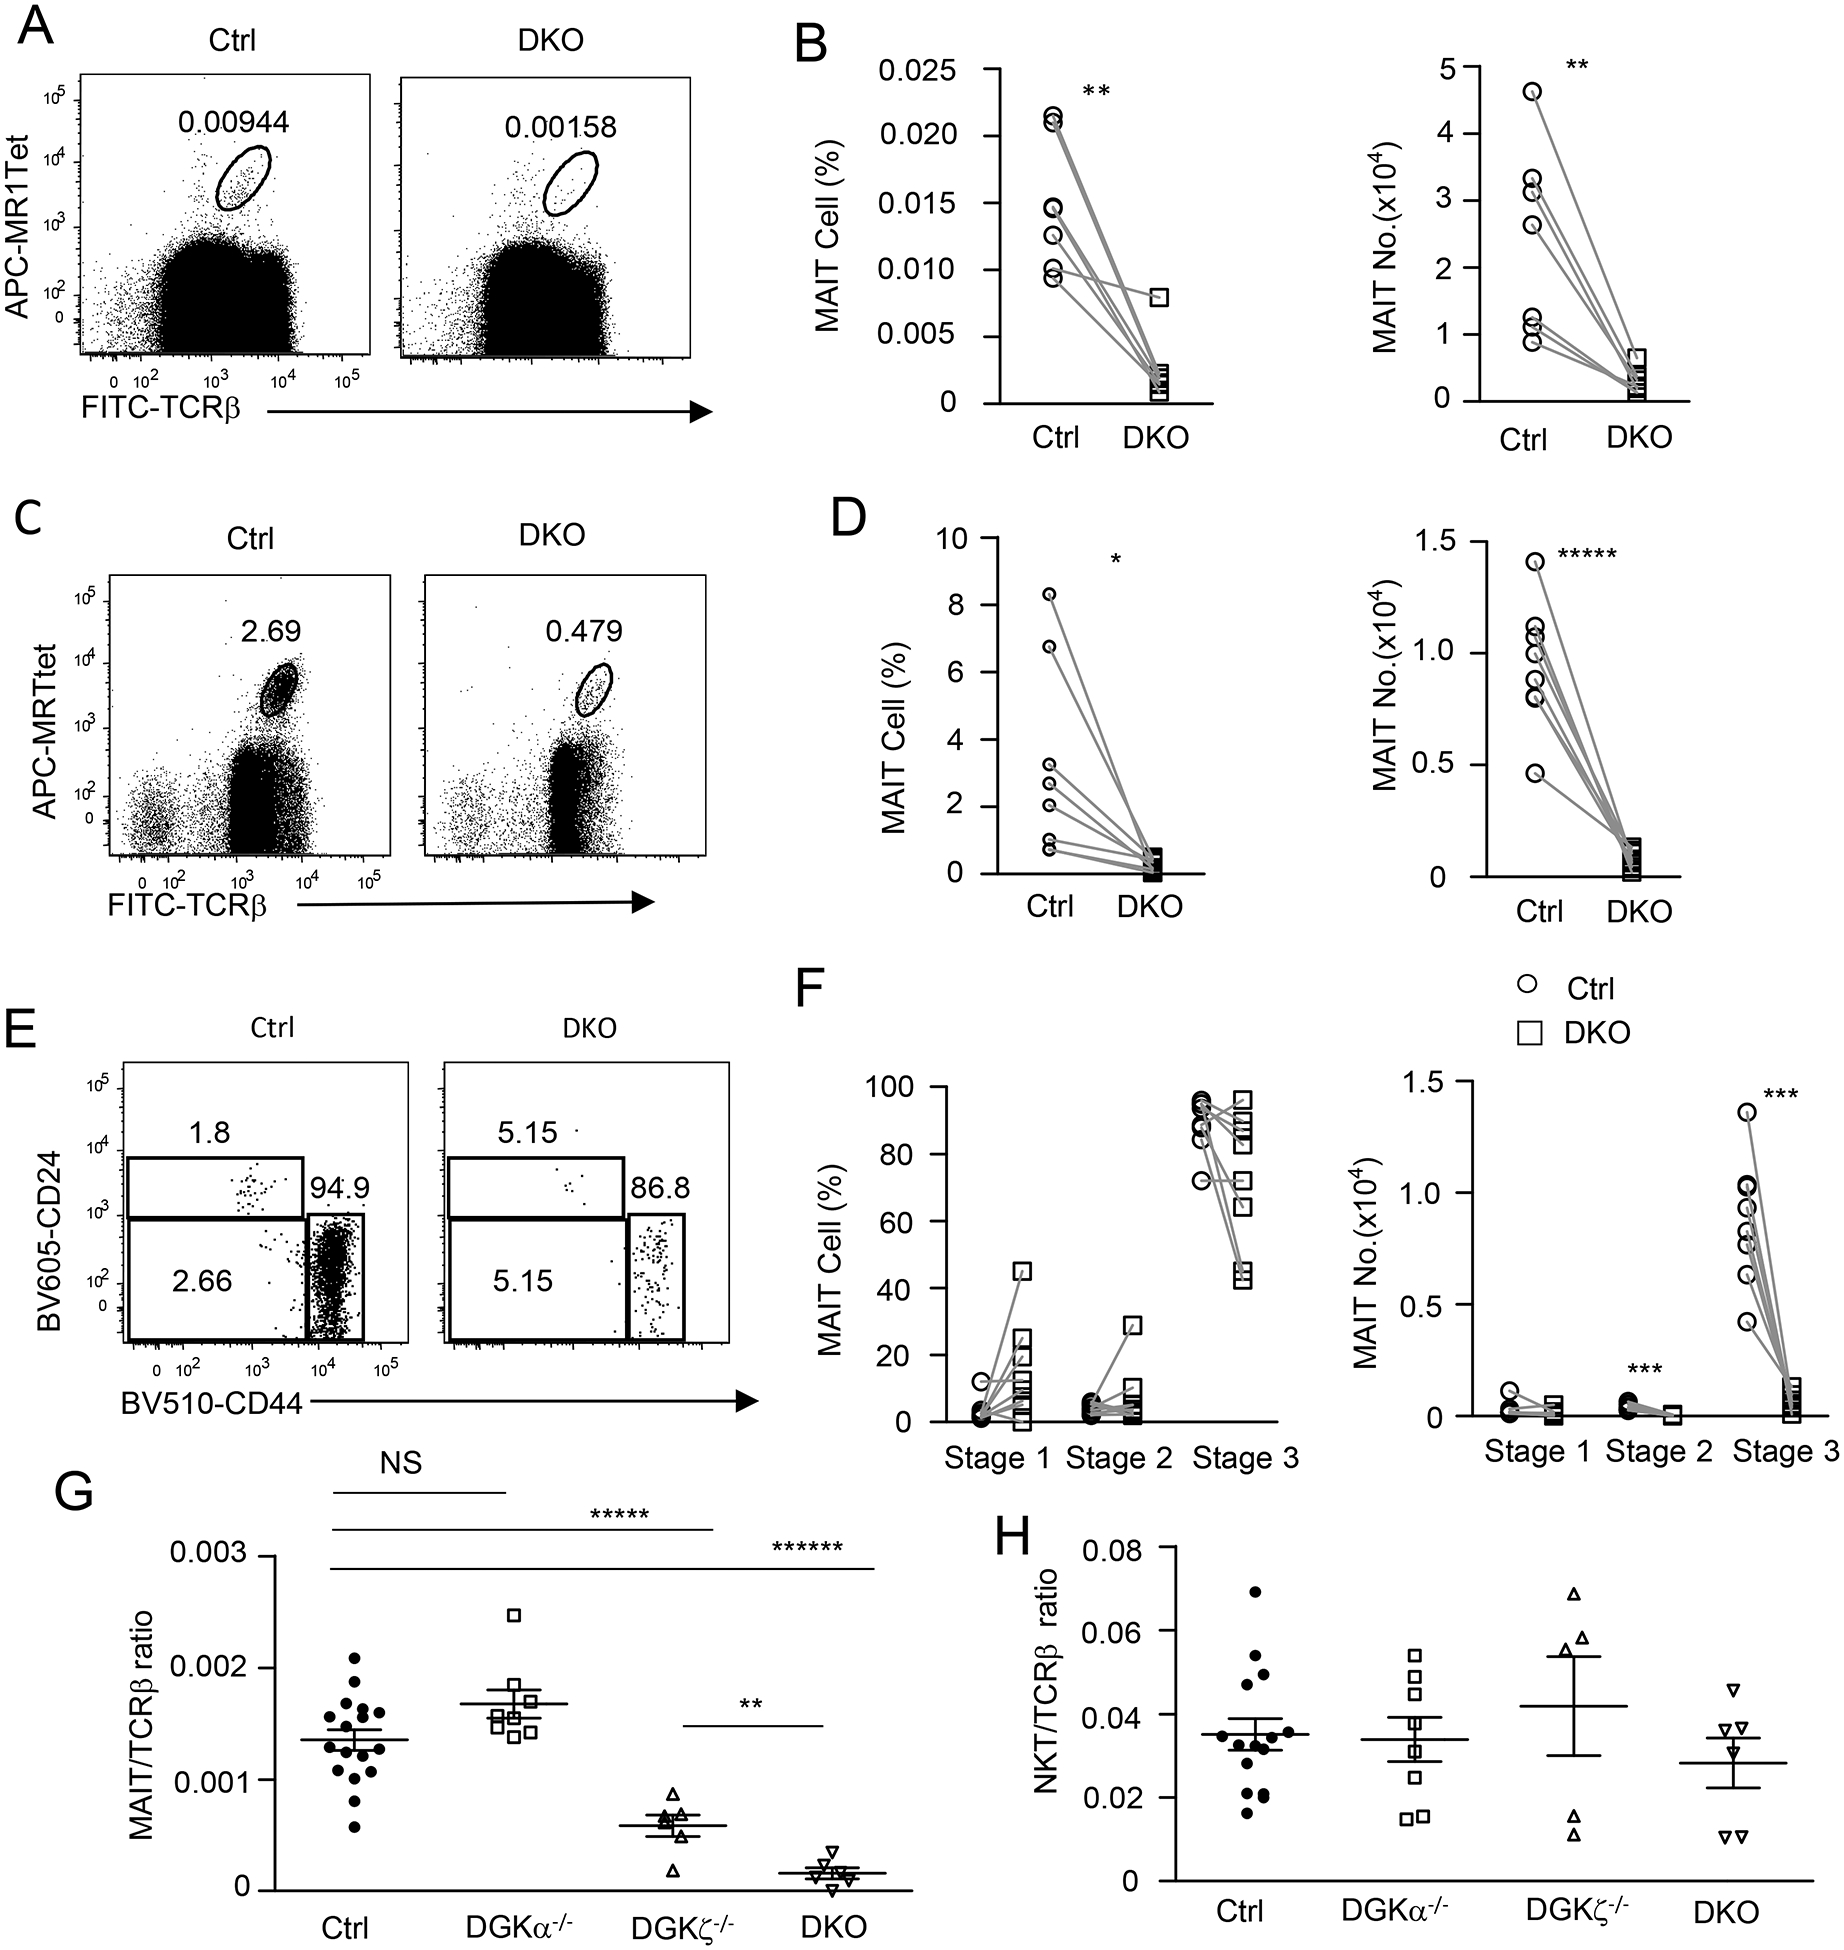
Figure 6. Severe decreases of thymic MAIT cells in DGKα and ζ double-deficient mice.

Thymocytes from 8–10-week-old Dgka−/−Dgkzf/f-CD4Cre (DKO) mice and DGKα+/− or WT control mice were similarly stained and analyzed for MAIT cells without (A, B) or after MR1-Tet enrichment (C, D) as in Figure 1 and Figure 2. A, C. Dot plots show TCRβ and MR1-Tet straining in live gated Lin− cells without enrichment (A) or after enrichment (C). B, D. Scatter plots show MAIT cell percentages and numbers without enrichment (B) and after enrichment (D). E. Representative dot plots show CD24 and CD44 expression in live gated Lin− TCRβ+MR1-Tet+ MAIT cells. F. Scatter plots show stage 1–3 MAIT cell percentages and numbers. G. MAIT to cαβT cell ratios in the thymus (horizontal bars represent mean ± SEM). H. iNKT to cαβT cell ratios in the thymus (horizontal bars represent mean ± SEM). For A and B, data shown are representative of or pooled from seven experiments (N = 7 for both WT and DKO mice). For C - F, data shown are representative of (C, E) or pooled from (D, F) eight experiments (N = 8 for both WT and DKO mice). For G, data shown are pooled from at least six experiments (N = 17 for control, N = 8 for DGKα−/−, N = 8 for DGKζ−/−, and N = 6 for DKO). For H, data shown are pooled from at least five experiments (N = 15 for control, N = 8 for DGKα−/−, N = 5 for DGKζ−/−, and N = 6 for DKO). Each circle, square, or triangle represents one mouse of the indicated genotypes. *, P<0.05; **, P<0.01; ***, P<0.001; ****, P<0.0001 determined by pairwise Student t-test (B, D, F) and unpaired Student t-test (G, H).
