
Figure 1.
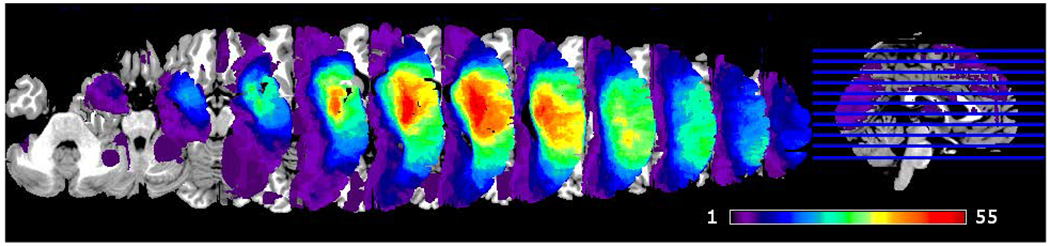
Lesion coverage map. Color bar represents lesion overlap among participants (1 – single participant, 55 - 55 participants with lesion in the area). Image in neurological convention.
Official websites use .gov
A
.gov website belongs to an official
government organization in the United States.
Secure .gov websites use HTTPS
A lock (
) or https:// means you've safely
connected to the .gov website. Share sensitive
information only on official, secure websites.
Lesion coverage map. Color bar represents lesion overlap among participants (1 – single participant, 55 - 55 participants with lesion in the area). Image in neurological convention.