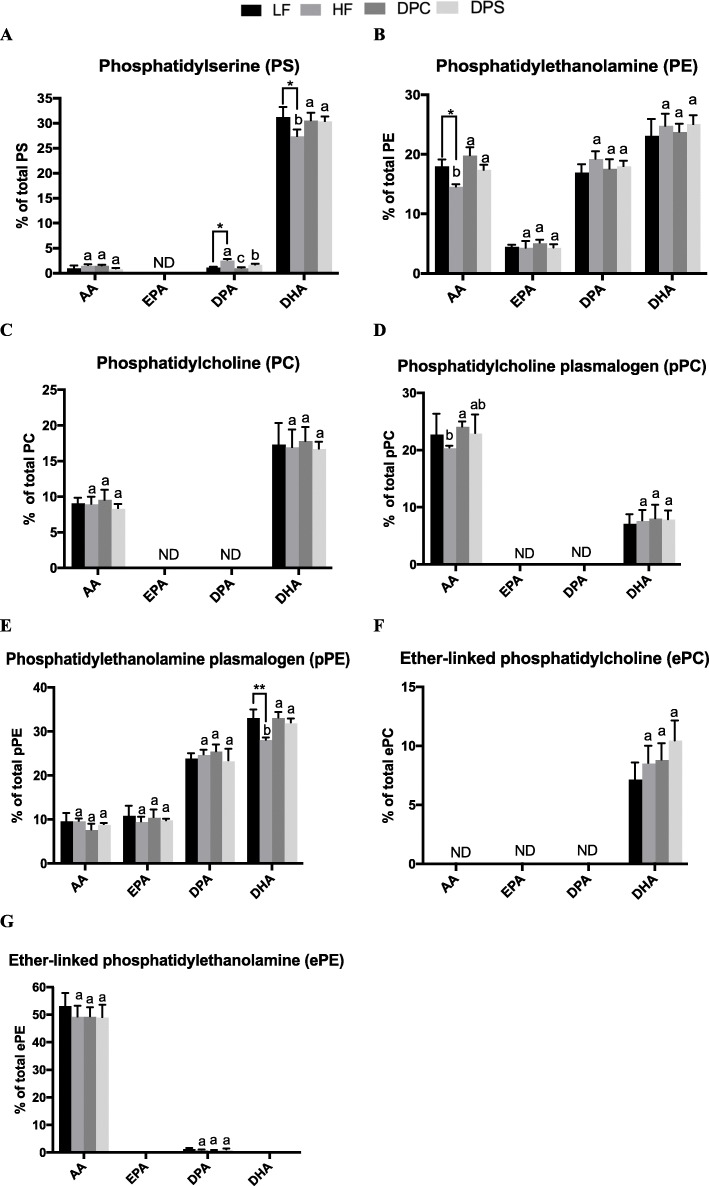
Fig. 2.
The relative abundance of polyunsaturated fatty acid (PUFA) including AA, EPA, DPA and DHA attached glycerophospholipid following different dietary interventions within 2 months. a The relative percentage of each PUFA attached phosphatidylserine (PS) occupied in total PS of cerebral cortex. b The relative percentage of each PUFA attached phosphatidylethanolamine (PE) occupied in total PE of cerebral cortex. c The relative percentage of each PUFA attached phosphatidylcholine (PC) occupied in total PC of cerebral cortex. d The relative percentage of each PUFA attached phosphatidylcholine plasmalogen (pPC) occupied in total pPC of cerebral cortex. e The relative percentage of each PUFA attached phosphatidylethanolamine plasmalogen (pPE) occupied in total pPE of cerebral cortex. f The relative percentage of each PUFA attached ether-linked phosphatidylcholine (ePC) occupied in total pPE of cerebral cortex. g The relative percentage of each PUFA attached ether-linked phosphatidylethanolamine (ePE) occupied in total ePE of cerebral cortex. ND meant that substance were not detected. Results were presented as mean and standard deviation (n = 8). The comparison of LF and HF group was tested by unpaired two-tailed student’s t-test *P<0.05;**P<0.01; Different letters among HF, DPC and DPS groups represented significant difference at P < 0.05 determined by ANOVA (Tukey’s test)

