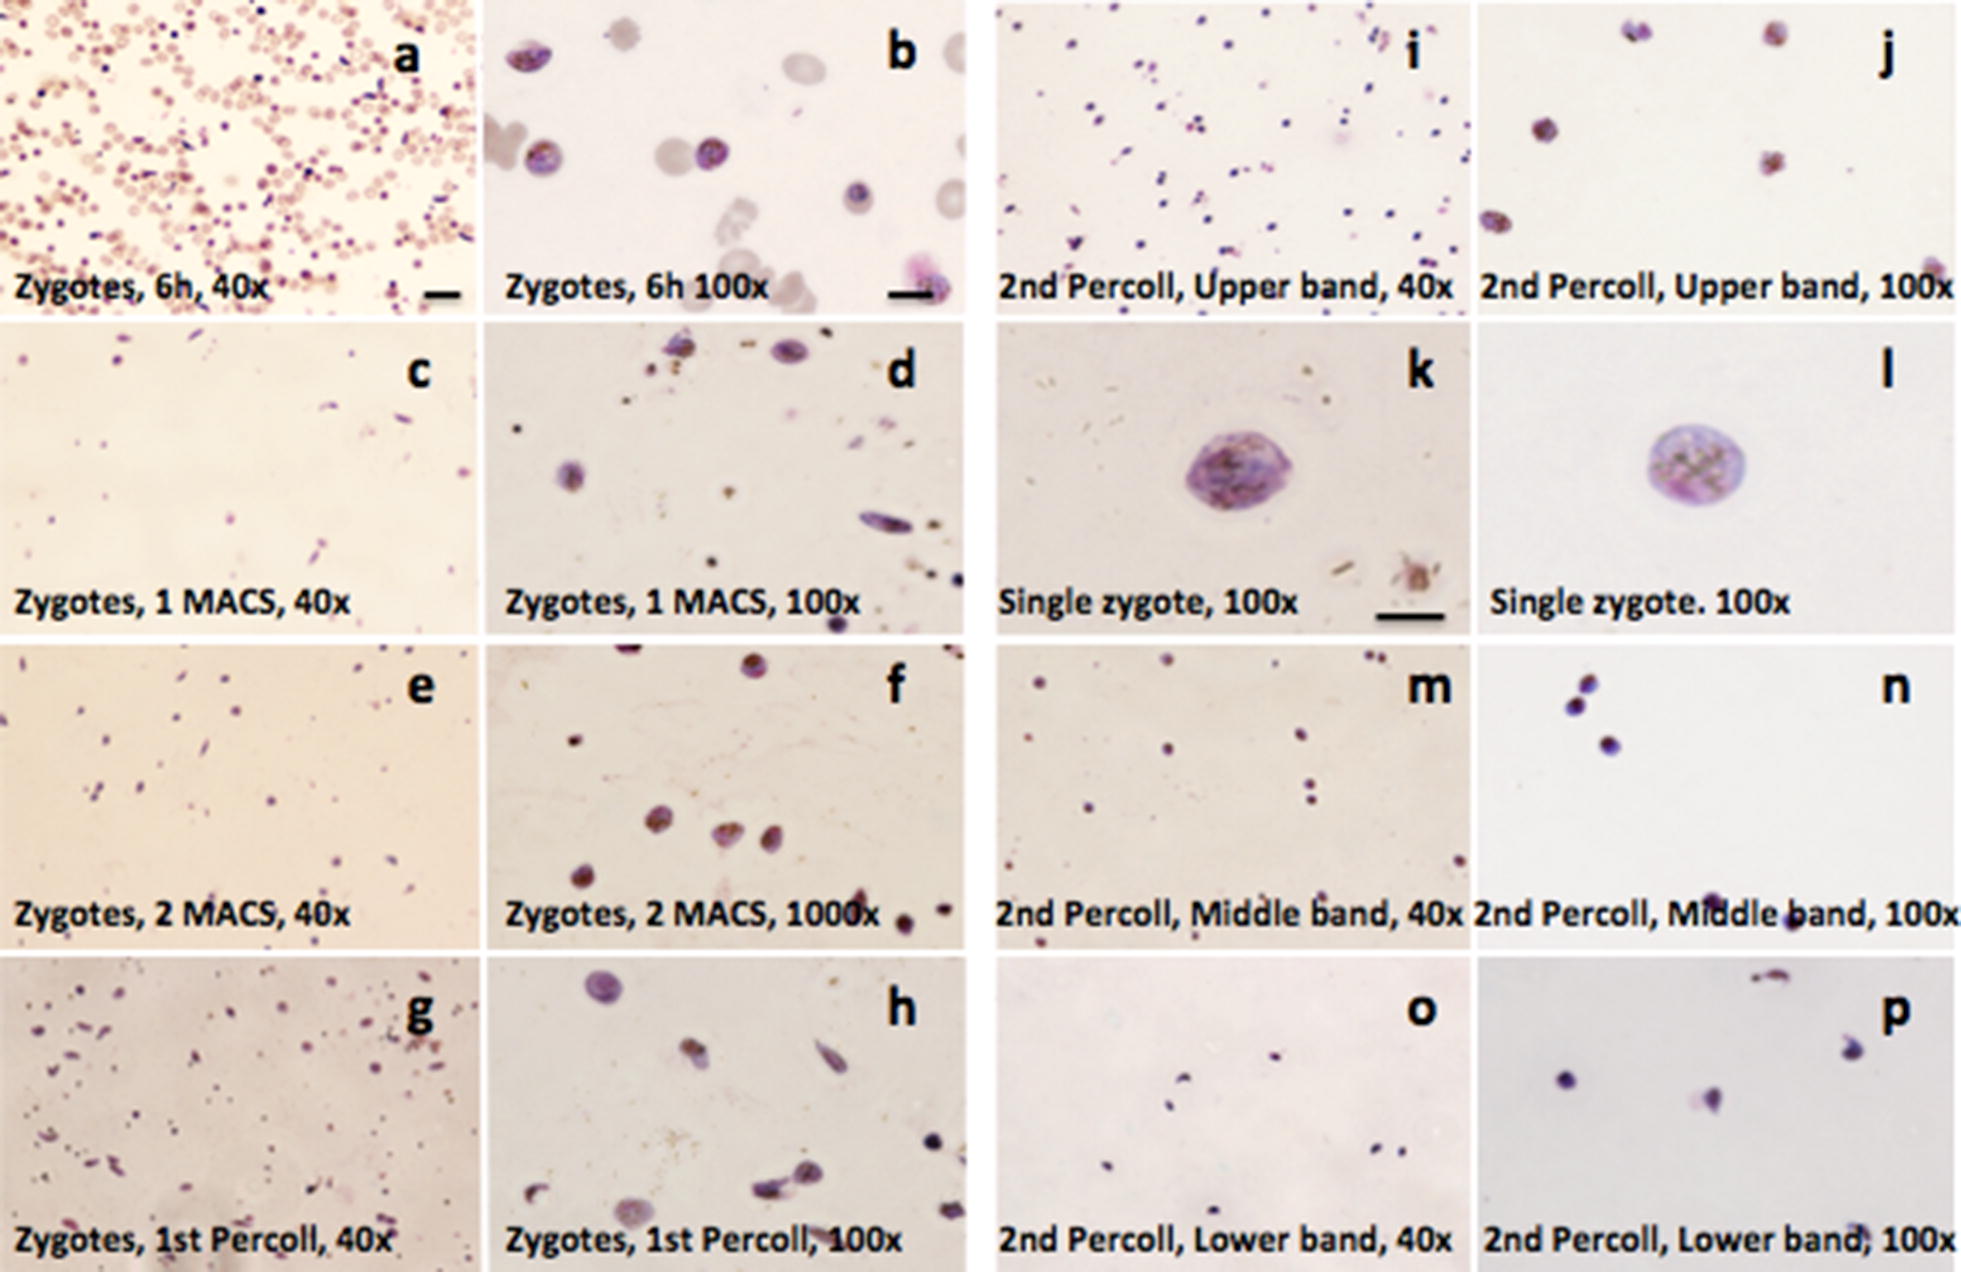
Fig. 3.

Giemsa staining of purified material from 2 MACS and 2 Percoll gradients. a Zygotes after 6 h in ookinete media at 40x; b Same at 100x; c Zygotes after 1st MACS at 40x; d Same at 100x; e Zygotes after 2nd MACS at 40x; f Same at 100x; g Zygotes after 1st Percoll at 40x; h Same at 100x; i Zygotes from 2nd Percoll upper band at 40x; j Same at 100x; k Same enlarged; l Same in different field; m Zygotes from 2nd Percoll middle band at 40x; n Same at 100x; o Zygotes from 2nd Percoll lower band at 40x; p Same at 100x. Panel a, c, e, g, i, m, o: scale bar = 20 µm; b, d, f, h, j, n, p: scale bar = 10 µm; k, l: scale bar = 5 µm
