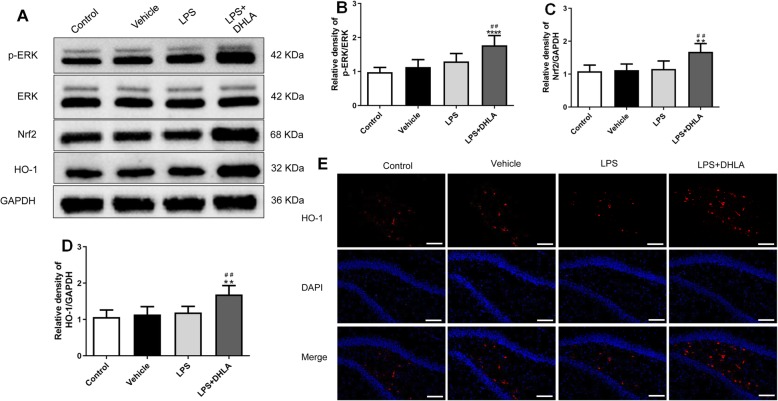
Fig. 3.
Effect of DHLA on ERK/Nrf2/HO-1 signaling pathway in rats. a Representative Western blot bands in the hippocampal region. b–d Statistical graphs of relative protein expression of p-ERK/ERK (b), Nrf2 (c), and HO-1 (d). The data were expressed as means ± SEM (n = 6). e Representative images of immunofluorescence assays of HO-1 in the hippocampal. Scale bars represent 50 μm. The data were expressed as means ± SEM (n = 3). **P < 0.01; ****P < 0.0001 versus the control group. ##P < 0.01 versus the LPS group. The Shapiro-Wilk test results showed that all the data are normally distributed (p > 0.05)

