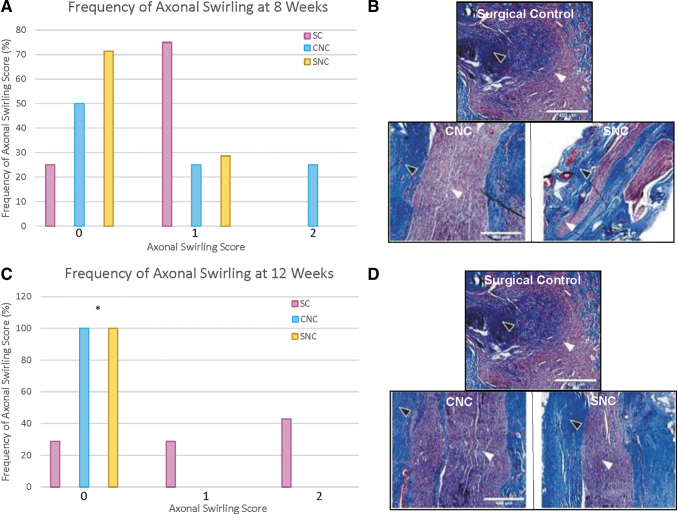
FIG. 3.
Axonal swirling analysis (A) at 8 weeks, there was no statistically significant difference among the groups, with more than 75% of all scores between 0 and 1. (B) Representative micrographs of 8-week Masson's trichrome staining. Axonal swirling can be observed by axonal growth patterns (white arrowheads) through the collagen matrix (black arrowheads). (C) At 12 weeks, axonal swirling was scored a 0 in all animals in both nerve cap groups. The SC group showed significantly higher axonal swirling compared to both the CNC and SNC groups (*p = 0.0210 and 0.0210, respectively). (D) Representative micrographs of 12-week Masson's trichrome staining. SC, surgical control.

