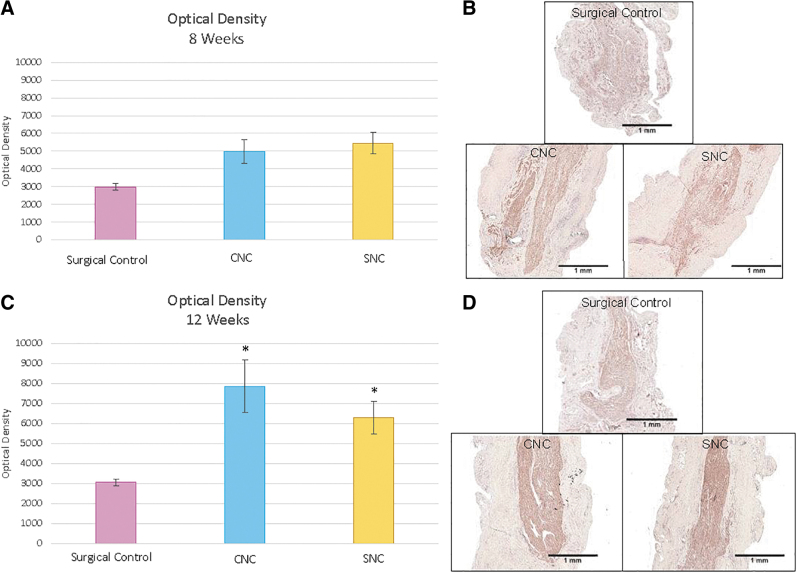
FIG. 4.
Optical density values (mean ± SEM) (A) optical density values within the distal nerve segment at 8 weeks. There were no significant differences between the three groups. (B) Representative micrographs of 8-week neurofilament staining that were used for optical density measurements. (C) Optical density values within the distal nerve at 12 weeks. The CNC group had a statistically higher optical density than the SC group (*p = 0.0004). The difference between the SNC and SC group was also statistically significant (*p = 0.0002). There was no difference between the CNC and SNC groups (p = 0.9787). (D) Representative micrographs of 12-week neurofilament staining that were used for optical density measurements. SEM, standard error of the mean.

