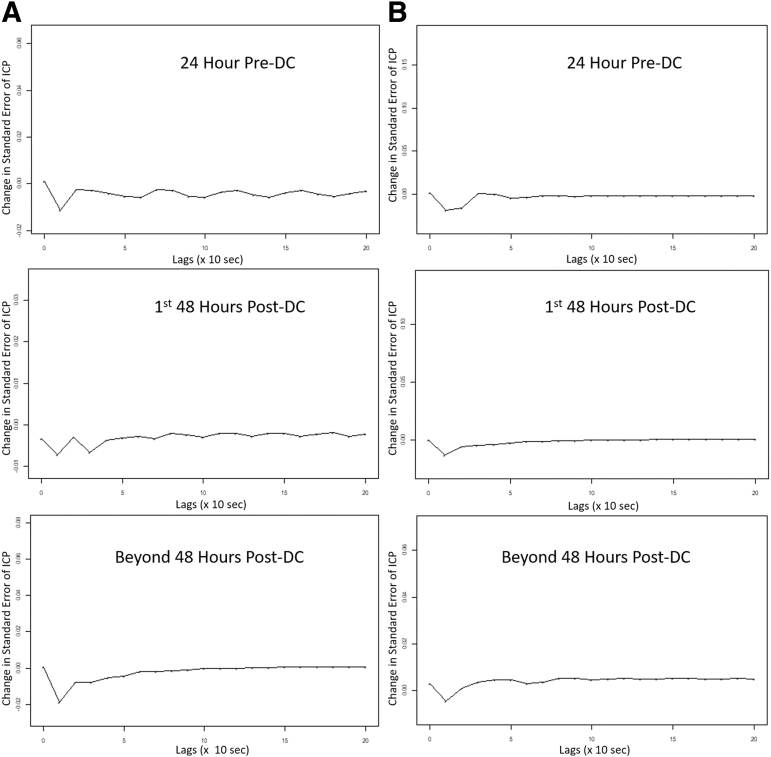
FIG. 2.
ICP and MAP slow-wave VARIMA generated IRF plots—patient examples. The above plots display two patient examples (A and B) of typical IRFs for a one standard deviation impulse in MAP on the standard error in ICP, based on the VARIMA model of structure (4,1,4), derived in each individual patient. These plots suggest that craniectomy does not substantially impact the vasogenic slow-wave relationship between MAP and ICP. ICP and MAP are log transformed, and the Lag axis is reported in the number of 10-sec observations. DC, decompressive craniectomy; ICP, intracranial pressure; IRF, impulse response function; MAP, mean arterial pressure; min, minutes; VARIMA, vector autoregressive integrative moving average.

