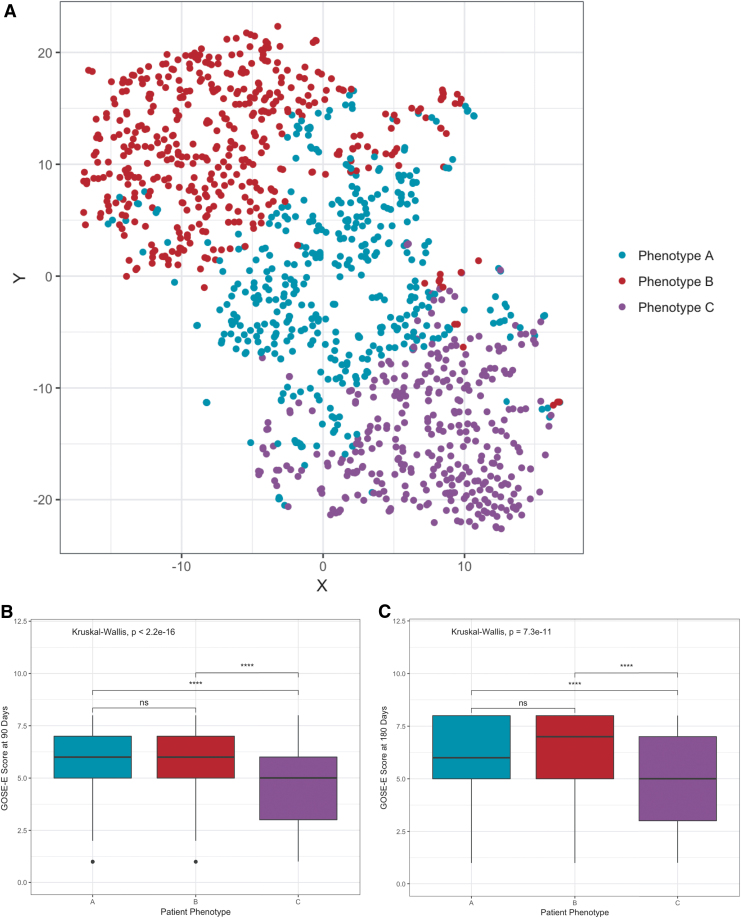
FIG. 3.
Partitional clustering reveals distinct traumatic brain injury phenotypes. (A) T-distributed stochastic neighbor embedding (T-SNE) projection of 1213 traumatic brain injury (TBI) patients from the Citicoline Brain Injury Treatment Trial (COBRIT) study, each dot representing one patient. The partitioning around medoids (PAM) clustering solution, which yielded the maximum average silhouette width, resulted in three clusters labeled phenotype A (teal, n = 420), phenotype B (red, n = 446), and phenotype C (purple, n = 347). X and Y axes denote two-dimensional (2-D) representation of six-dimensional feature space. Novel TBI phenotypes have different recovery outcome trajectories based on the Extended Glasgow Outcome Scale (GOS-E) scores at (B) 90 days and (C) 180 days post-injury. Statistical significance was computed using the Kruskal–Wallis test with Holm's correction for multiple comparisons (asterisks represent p values: ****p < 0.0001, p > 0.05 n.s.). Color image is available online.

