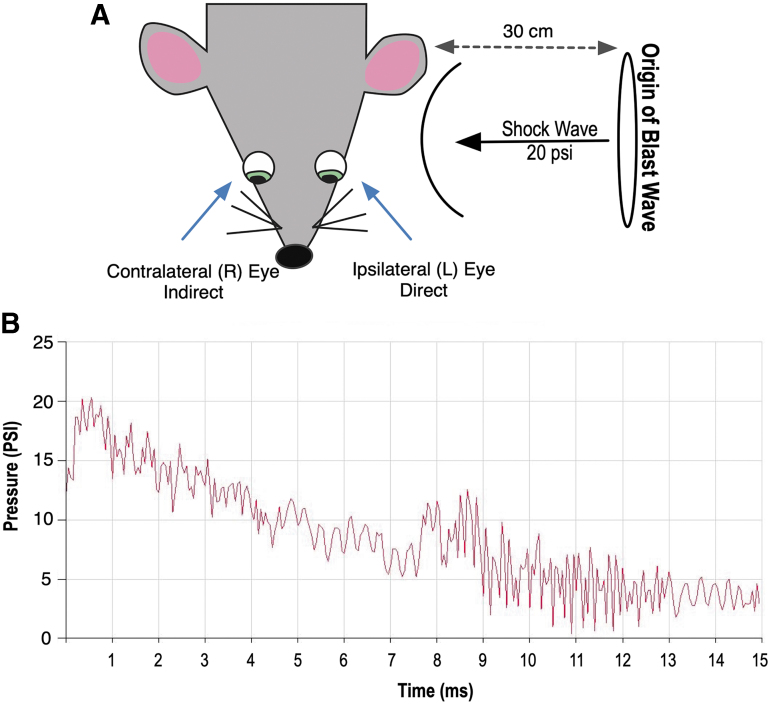
FIG. 1.
Schematic representation of blast exposure. Exposure to blast wave pressure was conducted as described previously.23 Animals were placed lateral to the shock tube axis, 30 cm from the origin of the blast wave (Mylar membrane), with the left (L) side of the head (ipsilateral eye) facing the blast wave. (A) Control mice were restrained the same way, but were not exposed to the blast wave. (B) A representative tracing of a 20 ± 0.2 psi (137.8 ± 1.3 kPa, mean ± SEM) blast wave.

