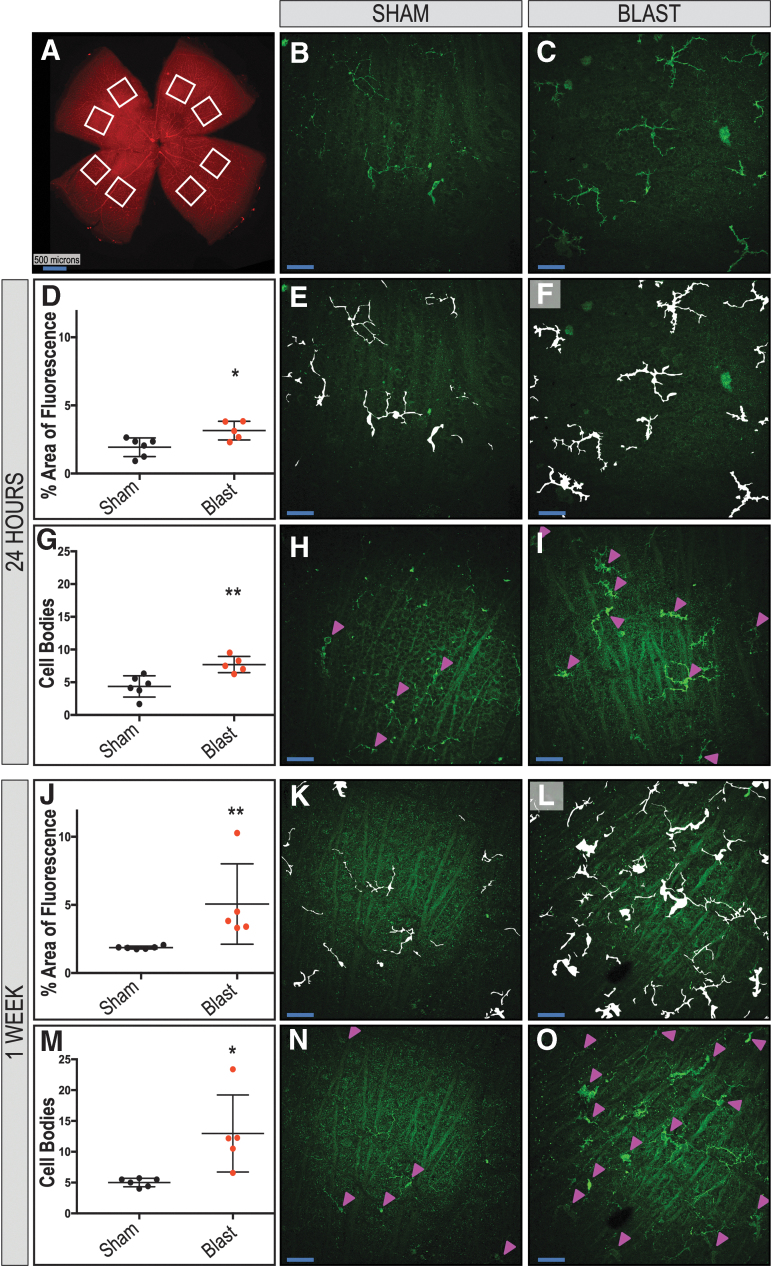
FIG. 2.
Increased immunoreactivity and distribution of IBA-1-positive microglia are found in retinas exposed to blast. Eight regions were sampled per ipsilateral retina (A). Quantification shows an increase in total fluorescence area (D, J) and cell body counts (G, M) after blast in the retinal nerve-fiber layer (RNFL) and retinal ganglion-cell layer of whole-mounted retinas at 24 h and one week, respectively. Representative images (B, C) and mask overlays of area are quantified (E, H, K, M and F, I, L, O) for sham and blast-injured mice, respectively. Arrowheads indicate cell bodies (H, I, N, O). Student t test or Mann-Whitney U test are based on distribution of data. *p < 0.05; **p < 0.01. Data are expressed as means ± SEM. n = 5–6 mice per group. X25, original magnification; en face view with the RNFL facing up. Scale bar: 50 μm unless otherwise noted.

