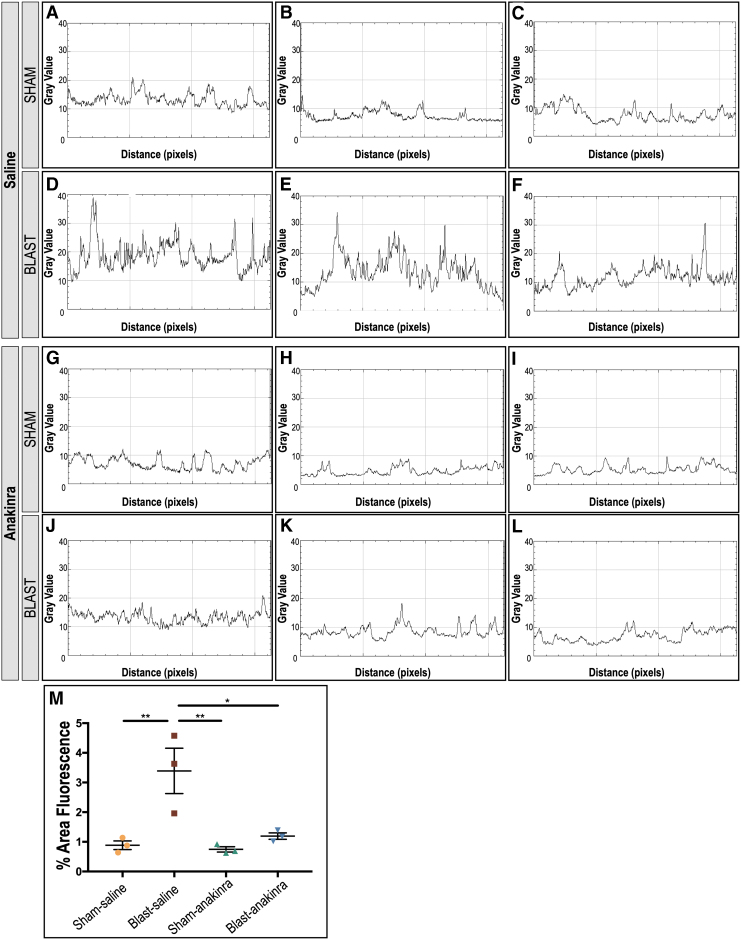
FIG. 5.
Quantification of glial fibrillary acidic protein (GFAP) suggests anakinra treatment prevents Müller glia activation in the retina after blast. Plot-profiles display pixel intensity of the GFAP staining in retinal cross section images from Figure 4. Blast-saline (D–F) images demonstrate increased GFAP intensity compared with sham-saline (A–C), sham-anakinra (G–I), and blast-anakinra (J–L). Quantification (M) demonstrates a significant increase in the total fluorescent area in the retinal sections from blast-saline mice when compared with all other groups. No other significant differences were found. Significance was determined by comparing means of all groups using one-way analysis of variance with the Dunnett post-test (*p < 0.05, **p < 0.01). Data expressed as means ± SEM. n = 3 per condition.

