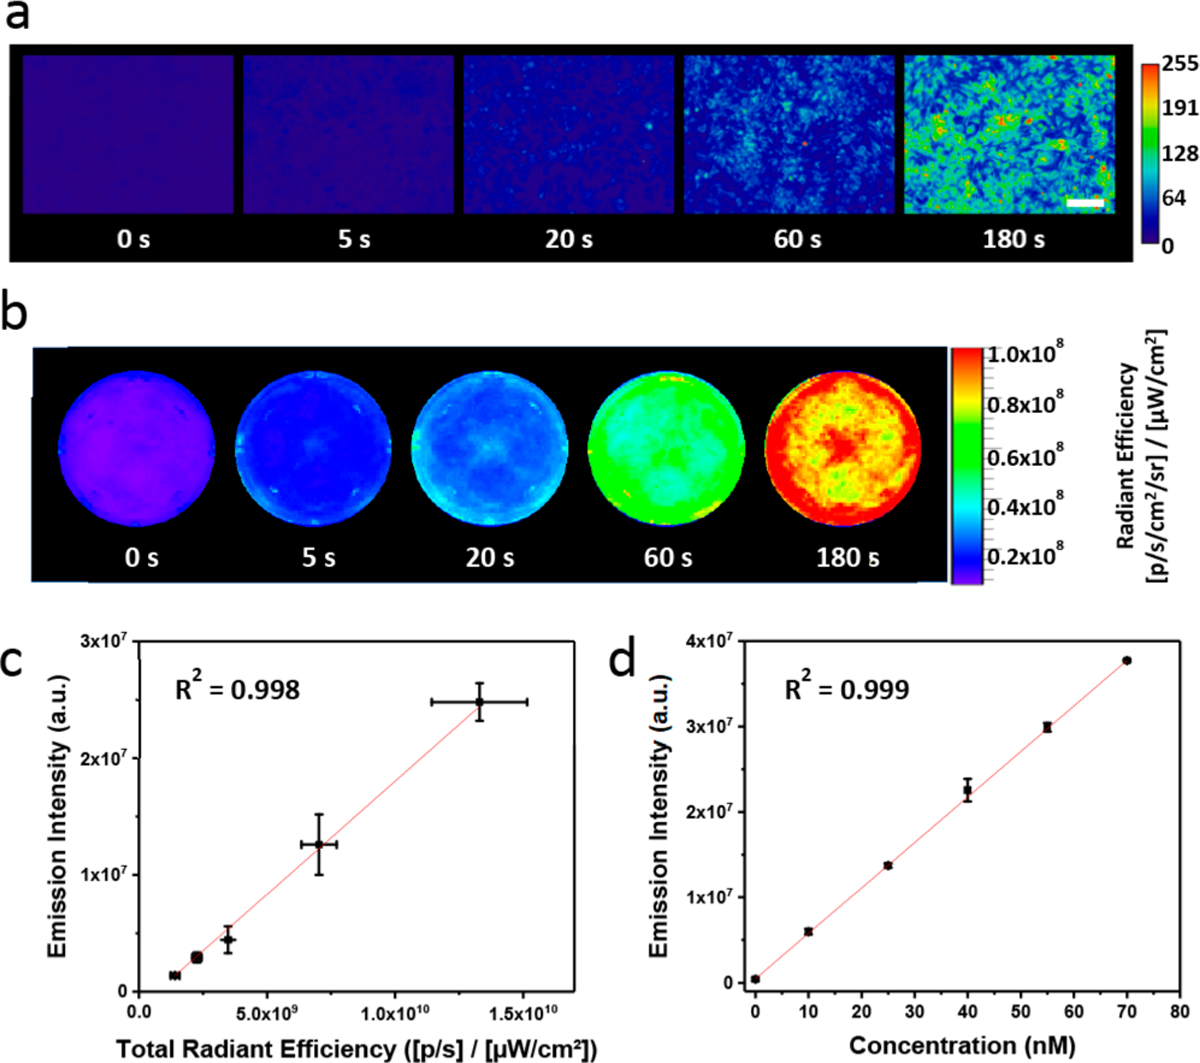
Figure 3.

(a) Epifluorescence and (b) IVIS images of HEK293 cells stained with photoFAD-3 after 0, 5, 20, 60, and 180 s of photoactivation. Scale bar represents 100 μm. (c) Correlation plot of in vitro cell lysate fluorescence versus total radiant efficiency. (d) Reference plot of in vitro fluorescence versus concentration of 4. Data are represented as mean ± SD (n = 3).
