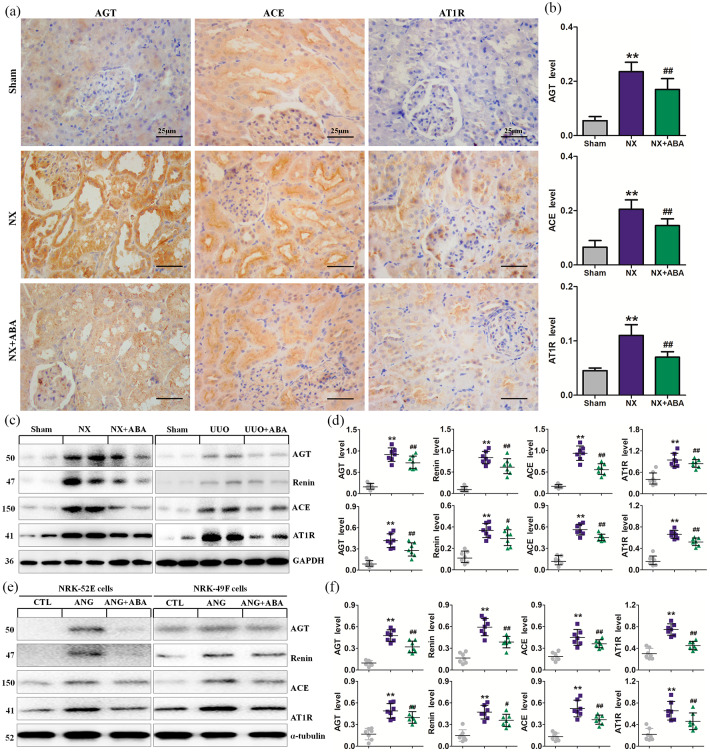
Figure 2.
ABA treatment inhibits the activation of RAS. (a) Representative micrographs of AGT, ACE and AT1R. (b) Quantitative analysis of AGT, ACE and AT1R in the different groups of NX rats. (c) Protein expression of AGT, renin, ACE and AT1R in the different groups of NX rats. (d) Quantitative analyses of protein expression of AGT, renin, ACE and AT1R in the different groups. (e) Protein expression of AGT, renin, ACE and AT1R in the different groups of NRK-52E and NRK-49F cells. (f) Quantitative analyses of protein expression of AGT, renin, ACE and AT1R in the different groups of NRK-52E and NRK-49F cells. *p < 0.05; **p < 0.01 versus sham or CTL group. #p < 0.05; ##p < 0.01 versus NX or UUO or ANG group (n = 7).
ABA, alisol B 23-acetate; ACE, angiotensin-converting-enzyme; AGT, angiotensinogen; ANG, angiotensin; AT1R, angiotensin II type 1 receptor; CTL, control; NX, 5/6 nephrectomised; RAS, renin–angiotensin system; UUO, unilateral ureteral obstructed.

