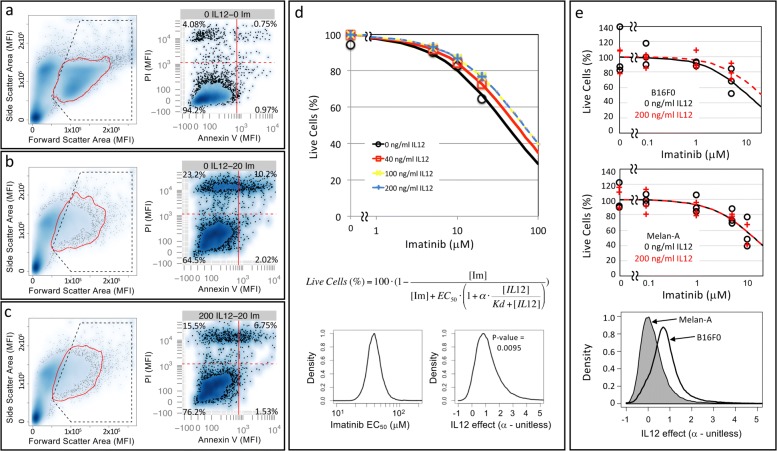
Fig. 2.
B16F0 melanoma cells but not Melan-A melanocytes can be rescued from the cytotoxic effect of imatinib by IL-12. Cell viability in response to different concentrations of IL-12 and imatinib was assayed by flow cytometry, whereby representative results for specific concentrations (a: No IL-12, No imatinib; b: 20 μM imatinib; c: 200 ng/mL IL-12 and 20 μM imatinib) are shown. Cell events were identified based on forward and side scatter properties (enclosed in red curve in left panel). Annexin V and PI staining were used to identify viable cells (PI negative, Annexin V negative), cells undergoing apoptotic (Annexin V positive, PI negative) and necrotic (Annexin V negative, PI positive) cell death, and cells in late stages of apoptosis (Annexin V positive, PI positive). d Using the collective observed data (symbols), a mathematical model was used to estimate the increase in EC50 of imatinib in the presence of IL-12. The curves trace the corresponding maximum likelihood predictions for each experimental condition. A Markov Chain Monte Carlo approach was used to estimate the model parameters. The posterior distributions in the EC50 of imatinib and the rescue effect of IL-12 (α) are shown in the bottom panels. e Viability of B16F0 cells (top panel) and Melan-A cells (middle panel) were assessed using an ATPlite assay following exposure to the indicated concentrations of imatinib in the presence (red curves) or absence (black curves) of 200 ng/mL IL-12. Results for three biological replicates at each condition are shown. The resulting data (symbols) were analyzed using a mathematical model, where the maximum likelihood predictions for each experimental condition are indicated by the curves. Using a Markov Chain Monte Carlo approach, the posterior distributions in the rescue effect of IL-12 (α) are shown in the bottom panels (Melan-A: grey shaded, B16F0: black curve)

