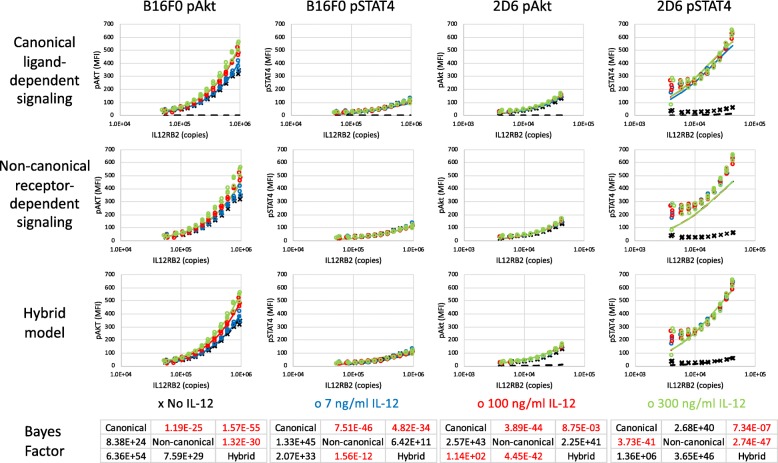
Fig. 5.
Canonical ligand-induced activation predominantly captures STAT4 activation in 2D6 cells while Akt activation in B16F0 cells is described by a hybrid model involving both non-canonical ligand-dependent and receptor-dependent activation. Stratifying flow cytometry events summarized in Fig. 4a-d by IL12RB2 expression, phosphorylation of Akt and STAT4 for a subset of B16F0 (left two columns) and 2D6 (right two columns) cells are shown versus the corresponding subsets IL12RB2 abundance, expressed in copies per cell. Experimental results (symbols) are compared against simulation results using the maximum likelihood parameter estimates (lines) for three models: canonical ligand-dependent signaling (top row), non-canonical receptor-dependent signaling (second row), and a hybrid model encompassing both canonical and non-canonical models (third row). The Bayes Factor (bottom row) was calculated for each pairwise comparison between models, where i and j denote the row and column of the Bij entry and colored black if the value was greater than 150. Colors indicate untreated cells (black, x) and stimulation with 7 (blue, o), 100 (red, o), and 300 (green, o) ng/mL of IL-12

