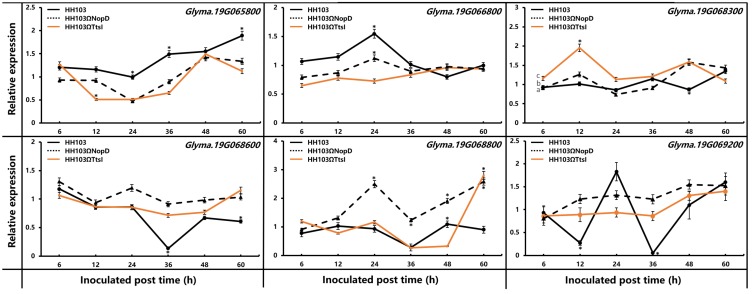
FIGURE 5.
Relative expression of Glyma.19g065800, Glyma.19g066800, Glyma.19g068300, Glyma.19g068600, Glyma.19g068800, and Glyma.19g069200 was measured by qRT-PCR in RNA extracted from roots of soybean Suinong14 plants inoculated with S. fredii HH103 wild-type or mutants HH103ΩNopD and HH103ΩTtsI. Uninoculated Suinong14 plants were used as the control. The 2–ΔΔCt method was used to calculate the relative expression levels of candidate genes. Error bars indicate the mean ± standard error of three replications. Significant differences were determined by t-tests, and “*” indicated the significant differences (p ≤ 0.05) at the time point.

