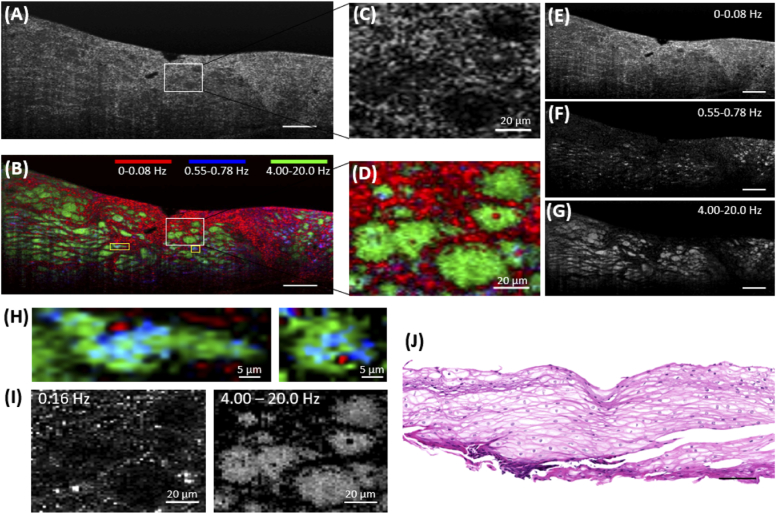
Fig. 1.
Images of a human esophageal biopsy. (A) A 200-frame averaged, standard µOCT image of the biopsy. (B) The pseudo-colored d-µOCT image shows numerous different cells exhibiting various intracellular motion-associated frequency content. (C) and (D) Magnified portions of the white ROIs shown in (A) and (B), respectively, from the same location in the sample. (E) to (G) Frequency maps of the human esophageal biopsy corresponding to the frequency ranges depicted in the red, blue, and green channels of (B), respectively. (H) Magnified views of the yellow ROIs in the d-µOCT image (B) showing cell cytoplasm (green), the nucleus (red), and a perinuclear region (blue), all exhibiting different frequency ranges. (I) d-µOCT images from the white ROI in (A) corresponding to different frequency ranges. (J) Corresponding histology image (H&E) of the biopsy sample. d-µOCT color codes: Red 0-0.08 Hz, Blue 0.55-0.78 Hz, Green 4.00-20.0 Hz. Bars = 100 µm unless indicated otherwise.

